
Welcome to the daily analytical report about the Hive blockchain.
All the information presented in this report is based on the data collected from the blockchain until 2021-05-07 midnight UTC time. The goal of this report is to provide you with a clear view of what is happening on the Hive blockchain.
 Este post está traducido al español - aquí
 Dieser Beitrag ist ins Deutsche übersetzt - hier
 Une version en français de ce post est disponible - ici
1. New users
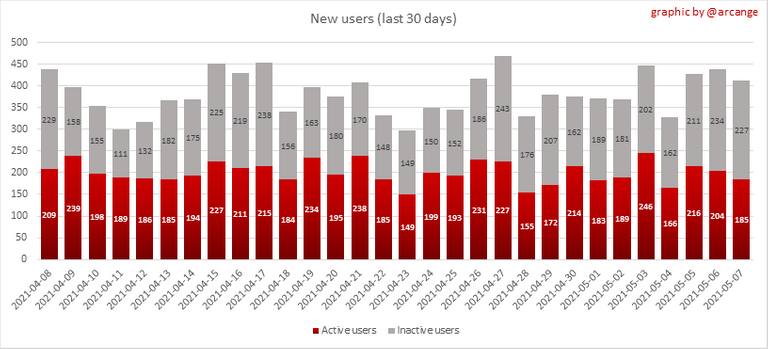
This chart shows the number of newly registered users on the blockchain and how many of them became active. The chart is kind of dynamic! A user can register one day and become active a few days later. Therefore, the number of active users on a specific date may change from day to day.
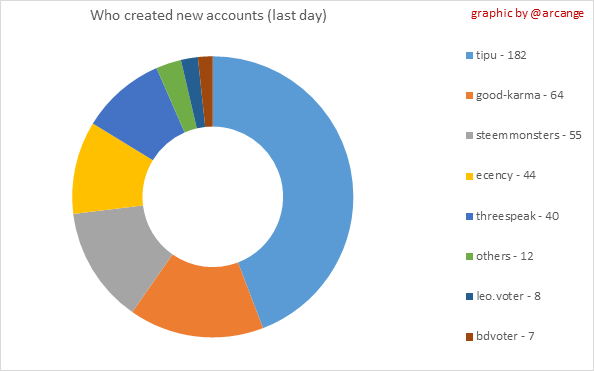 | 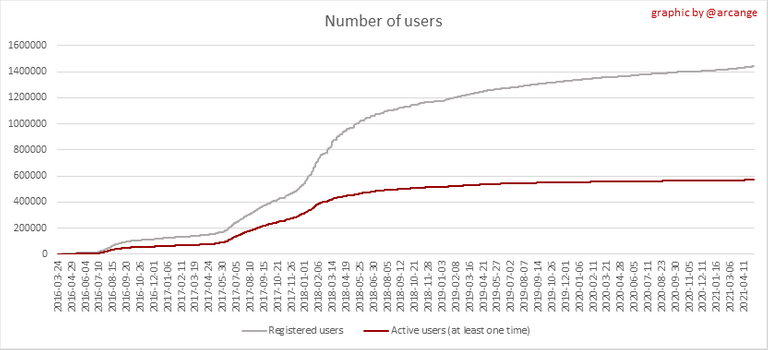 |
These two graphs show who created new accounts during the last day and the total number of registered accounts. The red line shows how many of them have been active at least once (active meaning publishing a post, commenting or voting). They are included even if they become inactive later.
2. Active users
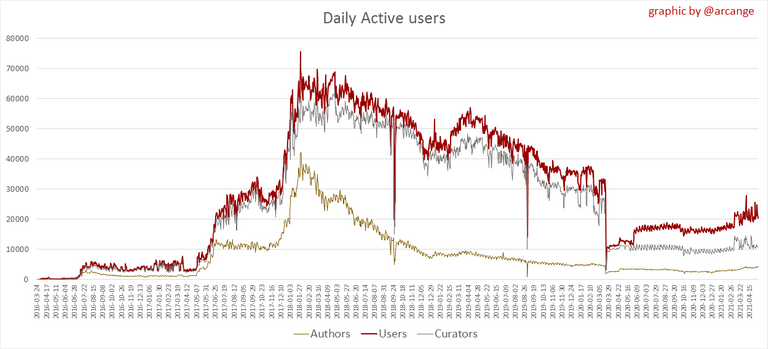 | 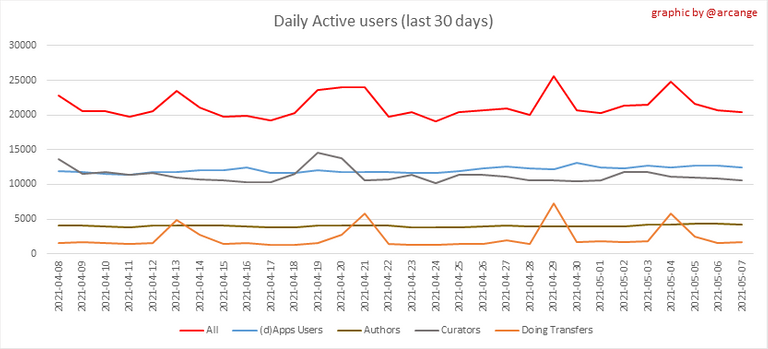 |
These graphs show the activity of users over time and in more detail for the last 30 days. In these graphs, "active users" are those performing any type of transaction on the blockchain.
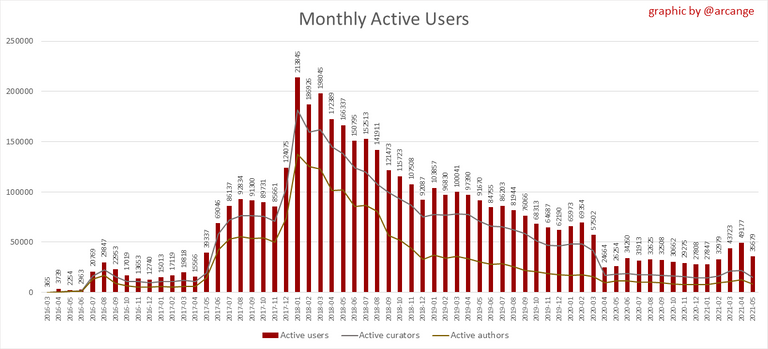
The last graph is a monthly summary of the active users. Be careful when interpreting the value of the last column which can be much lower if the end of the month has not yet been reached.
3. Apps & (d)Apps
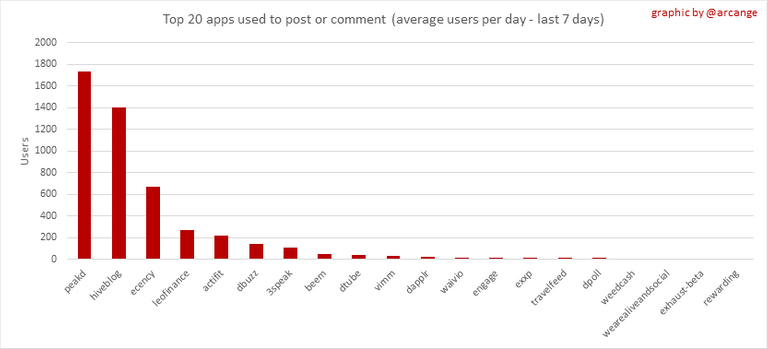
This graph shows which applications are most used to publish posts and comments. Please note that the same user can use several different applications.
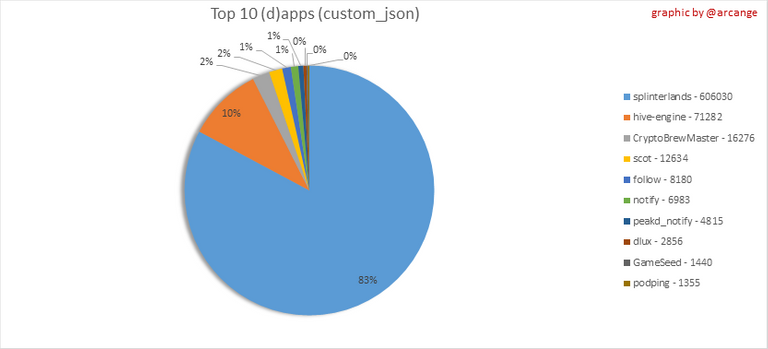
This graph shows which applications generate the most activity (custom_json operations) on the blockchain.
4. Posts And comments
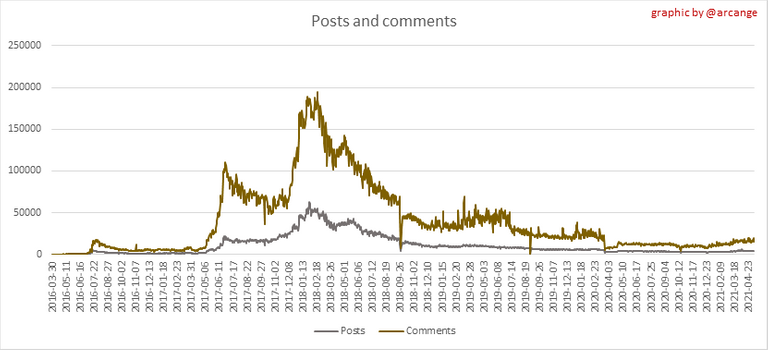 | 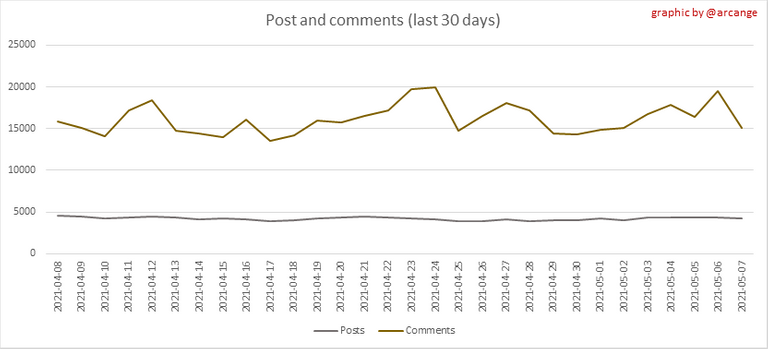 |
These graphs show the evolution of posts and comments for the whole blockchain lifetime and for the last 30 days.
5. Curation
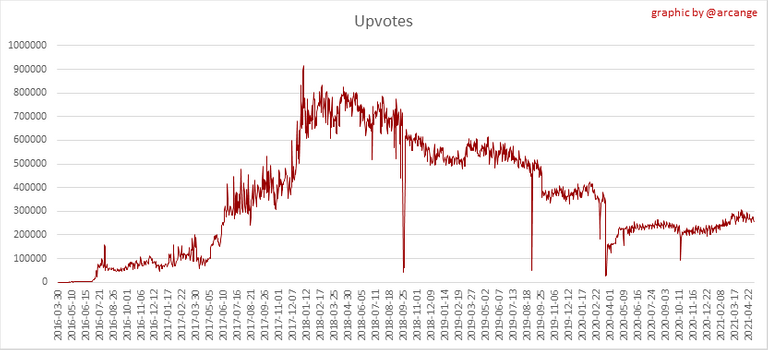 | 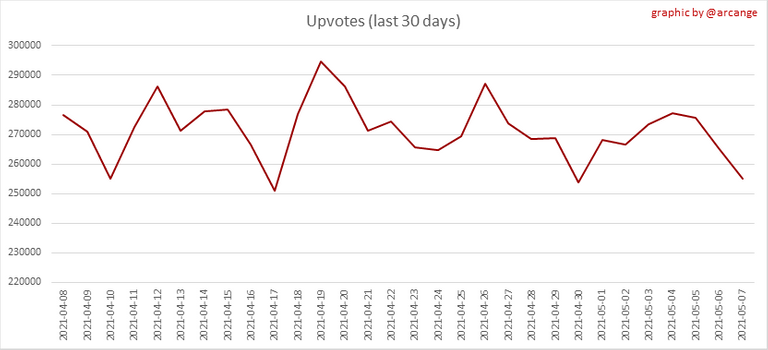 |
These graphs show the evolution of curation (upvotes) for the whole blockchain lifetime and for the last 30 days.
6. Daily transactions
![]()
This graph shows the number of daily transactions. This gives you an idea of the whole activity on the blockchain.
![]()
This graph shows the distribution of the top 15 types of transactions by number of operations performed on the blockchain.
7. Communities and Tags
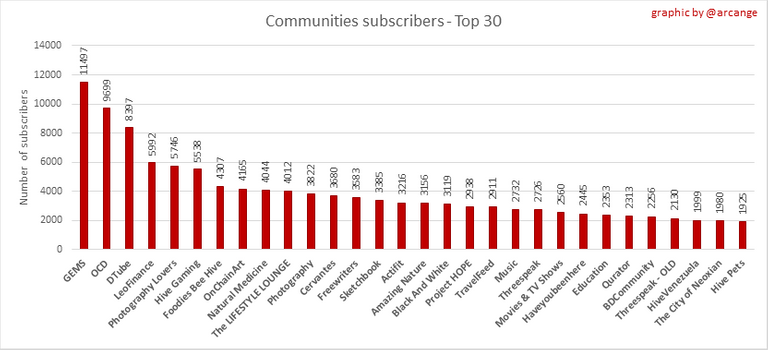
This graph shows the communities with the most subscribers.
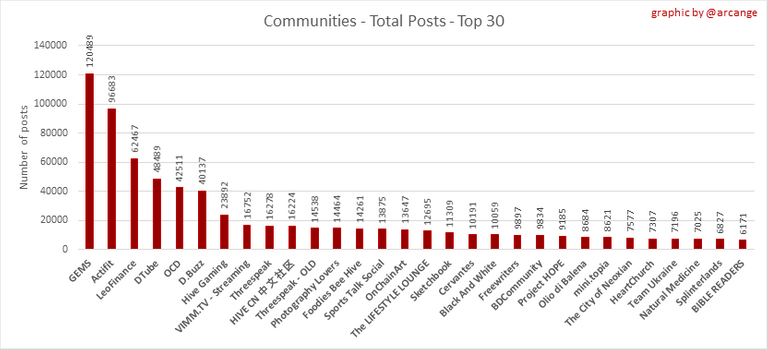 | 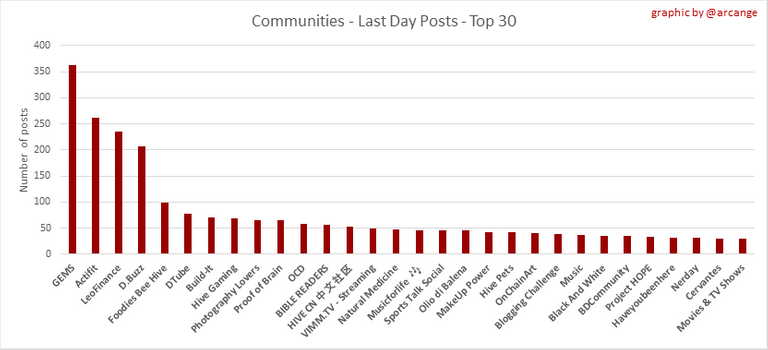 |
These graphs show the most active communities by number of posts (blockchain lifetime and last day).
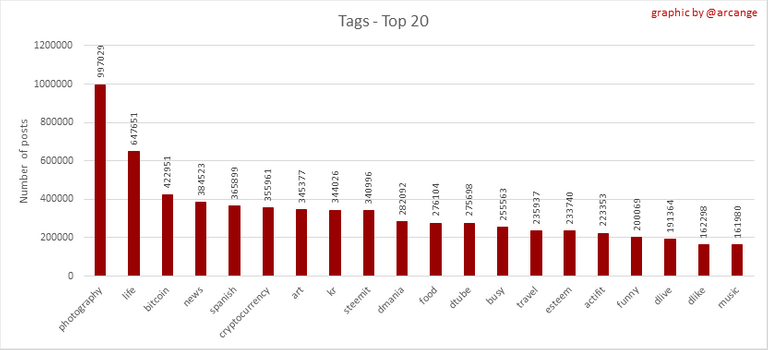 | 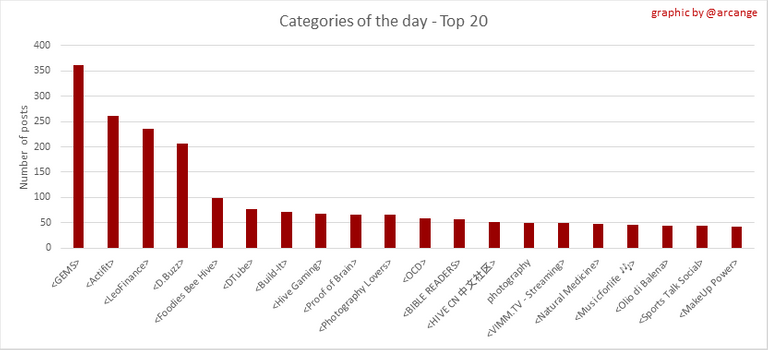 |
These graphs show which main tags have been the most used for publishing posts for the whole blockchain lifetime and for the last day.
8. Distribution
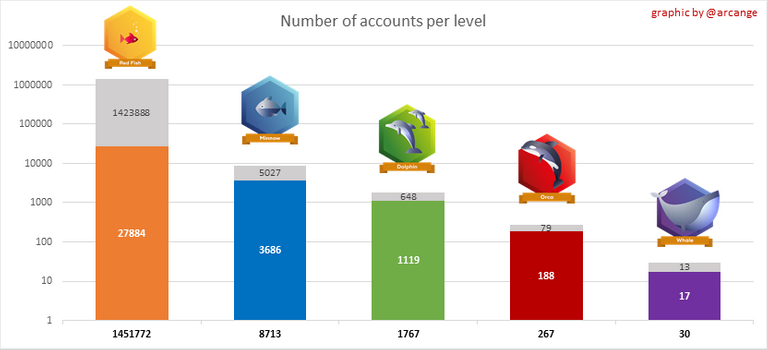 | 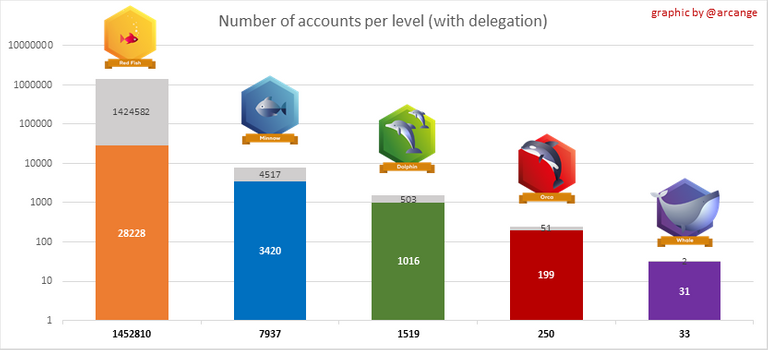 |
These graphs show the number of users according to their Hive Power. The left graph shows the distribution without taking into account any delegation made or received by the accounts. The right graph takes into account delegation, adds received HP delegation and subtracts given HP delegation.
The grey portion of each column indicates how many accounts are inactive (those who have not posted, commented or voted for the last 30 days).
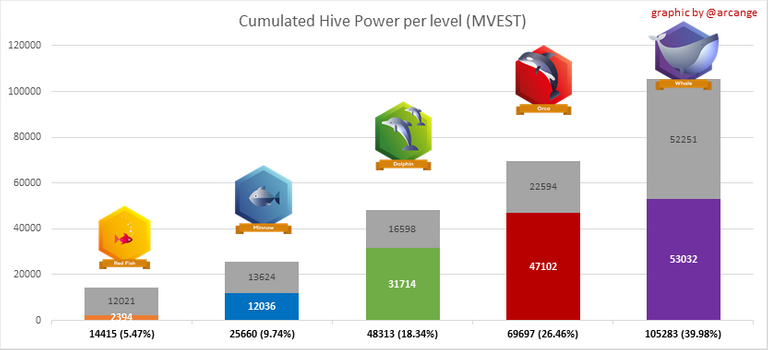 | 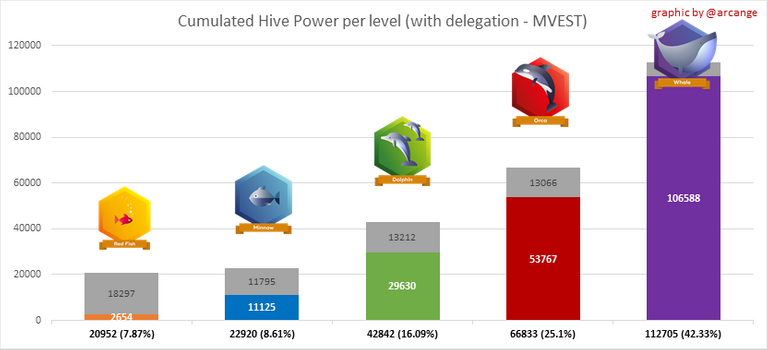 |
This graph shows the distribution of Hive Power cumulated per account level. The left graph shows the distribution without taking into account any delegation made or received by the accounts. The right graphs take into account delegation, adds received HP delegation and subtracts given HP delegation.
The grey portion of each column indicates unused Hive Power by inactive accounts (see above for the definition of inactive).
Below each column, you will also see a ratio to all existing Hive Power.
9. Payouts
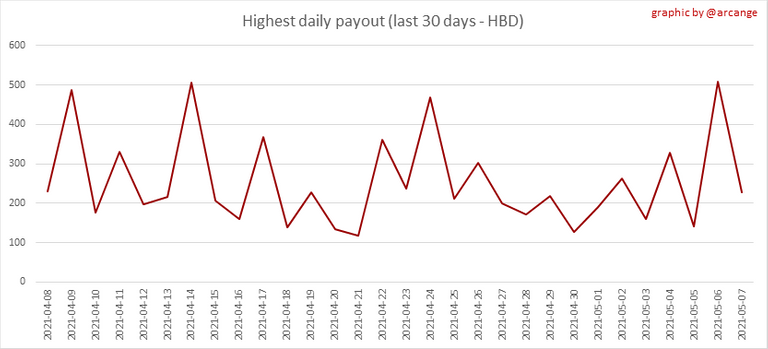
This graph shows the highest reward paid on a post (or comment) for the last 30 days.
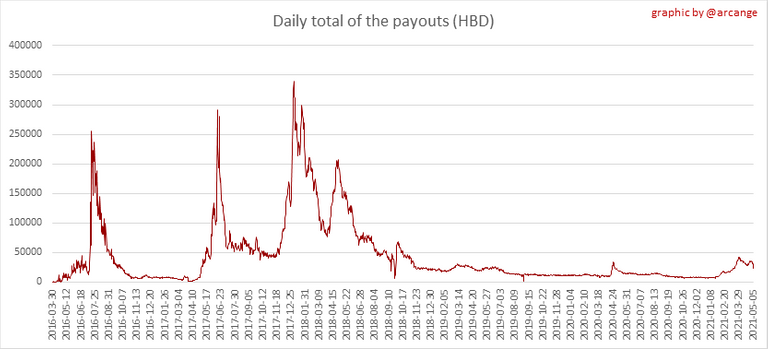 | 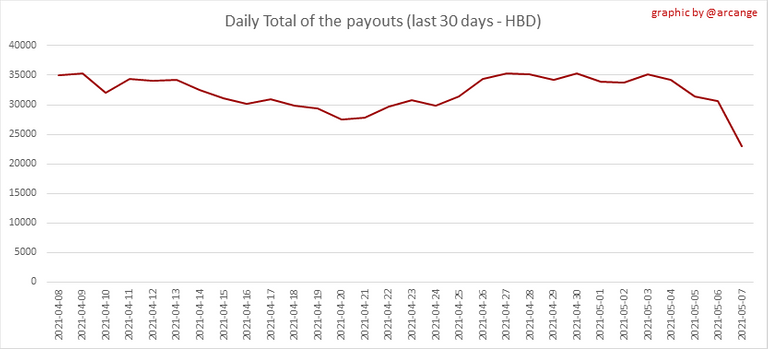 |
These graphs show the total of the distributed payout (posts and comments) for each day.
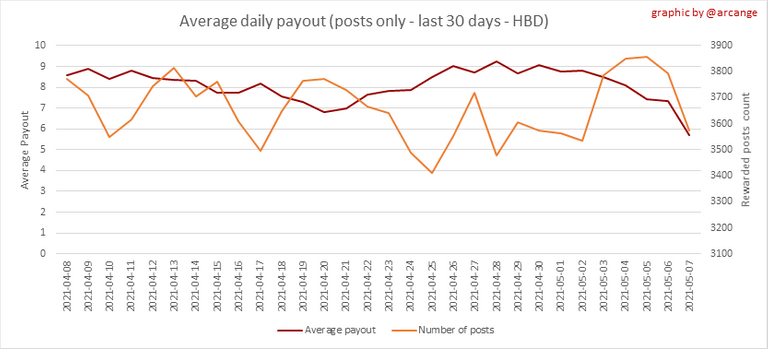 | 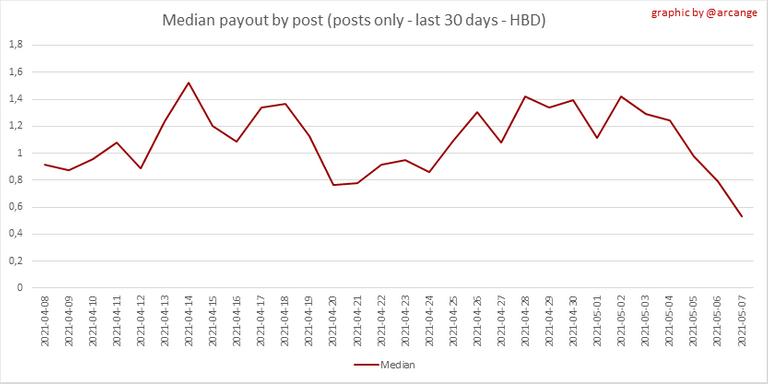 |
These graphs show the average and median payout per post for the last 30 days.
I hope you find those stats useful. If you would like to see different stats, feel free to drop me a comment. Your feedback is more than welcome.
Thanks for reading.
Check out my apps and services


Hi @arcange ! I love these stats and graphs! You made the visuals so clean, great way to make sense of the data.
I had a few ideas that might help these reach others or get more attention.
I realize this is more work for you, so I understand if you only want to use part of it, or if you're not into it at all. All good :) Hopefully it at least shows you that your data visualizations spoke to me.
I believe the data you're presenting here could help people understand Hive's current state & growth a lot better. It's valuable stuff and deserves more attention.
I took a moment to whip up a vision of how it might look:
Anyway, just wanted to check out your content and thank you for upvoting my Hive Beginner's Guide! Even though I'm new and don't know much, I appreciate all you do for Hive. Wishing you a great day.
Hey @ryzeonline, thank you for your feedback and good ideas. If you want to go further on this topic, feel free to contact me on Discord or Telegram
Meantime, I'll see if I can spare some time to implement some of them. 😅
Have a great day too!
Hey @arcange ! Thanks so much for replying, you rock, and I'd love to discuss this topic further.
I tried to add you on Discord, but perhaps I did something wrong? My discord addy is: ryzeonline#1404 , perhaps you can add me?
Anyway, apologies for the late reply, I've been neck-deep in a giant post about censorship and catching up on comments from my previous post, lol.
You should give a look at my Engage app. Huge timesaver.
User manual can be found here
Dude, I started using @hive.engage yesterday, this thing is epic. God-tier time saver and smooth workflow. The manual got me started, but the app's pretty intuitive anyway. And I love how fast and responsive it is. (Not sure if that cuz of clean code, great servers, or something else entirely, but I'll take it.) The designer in me has some UX/UI ideas that might improve it but even as is, I'm so grateful for this tool. PeakD would be wise to incorporate your code, or copy it, if you ask me. lol. Anyway, I appreciate it. 🙏
Thank you for this positive feedback.
Let's have a chat about that too 😉
And so we did! And it was epic! #staytuned :)
BTW, is there any way to contact you off-chain?
Apologies for my delayed response, I'm @ryzeonline on almost any major social platform, or can hook you up with my email if that's preferred?
In my other reply I gave my discord addy ( ryzeonline#1404 ) because I had some issue adding you. Hopefully that gets us connected, looking forward to discussing!
!BEER
!LUV
!PIZZA
@arcange! I sent you a slice of $PIZZA on behalf of @valentin86.
Learn more about $PIZZA Token at hive.pizza
Hi @arcange, you were just shared some LUV thanks to @valentin86. Holding 10 LUV in your wallet enables you to give up to 3 LUV per day, for free. See the LUV in your wallet at https://hive-engine.com or learn about LUV at https://peakd.com/@luvshares https://ipfs.io/ipfs/QmUptF5k64xBvsQ9B6MjZo1dc2JwvXTWjWJAnyMCtWZxqM
Thanks for your support lately! Thanks for sharing
You're welcome @vintageverve