It looks like X changed how it reports analytics again. They've added the granular data back that they took away a couple of weeks ago, but it looks different visually.
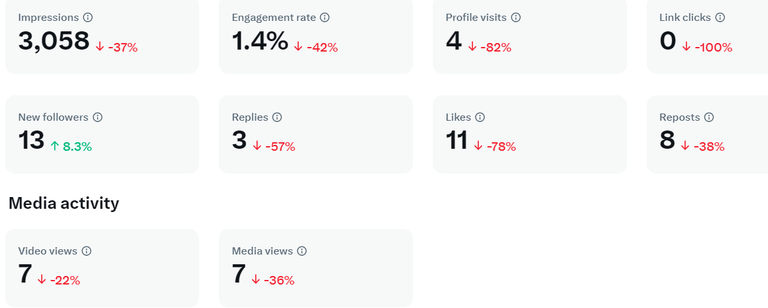
Impressions are down from last week by 37 percent, which I expected. Last week, they went up by 54 percent to more than 4,500 impressions. This past week, I was traveling. That meant I spent less time on social media in general. Impressions went down 37 percent to 3,058. That's about where impressions have hovered for the past several months.
Every metric, except one, went down this week. New followers went up by 8.3 percent to 13 new followers.
The following metrics declined:
- Engagement rate fell 42 percent to 1.4 percent
- Profile visits declined by 82 percent to 4
- Replies slid 57 percent to 3
- Likes dropped 78 percent to 11
- Reposts decreased 38 percent to 8
- Video views tumbled 22 percent to 7
- Media views succumbed to a 36 percent decline to 7
Now let's look at the granular data.
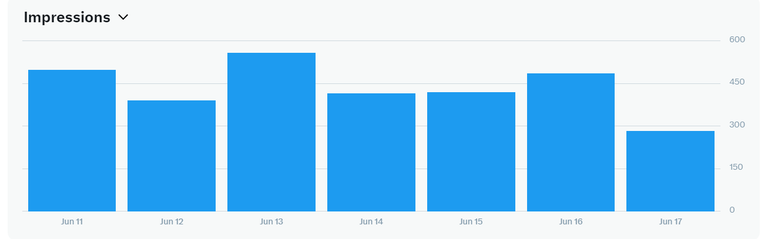
Impressions topped off on June 13 with 560. For the most part, they were study all week. The second-highest day was June 11 with 499 impressions.
Impressions were more than 400 for 5 days out of 7. One day, June 12, they were at 392. The lowest day of all was today with 284 impressions. Not a bad week for impressions.
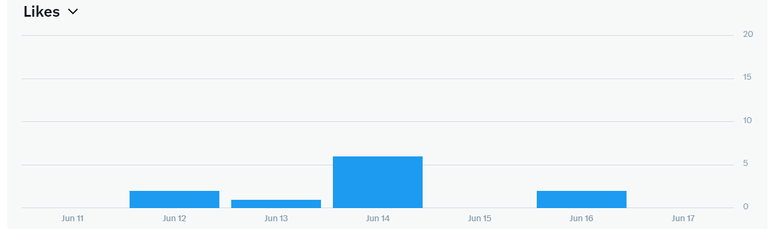
Out of 11 likes this week, 6 of those fell on one day -- June 14.
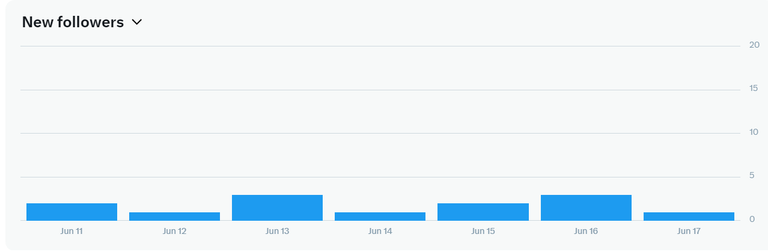
New followers were pretty steady over the week. Two days resulted in 3 new followers, but I picked up at least 1 every day this past.
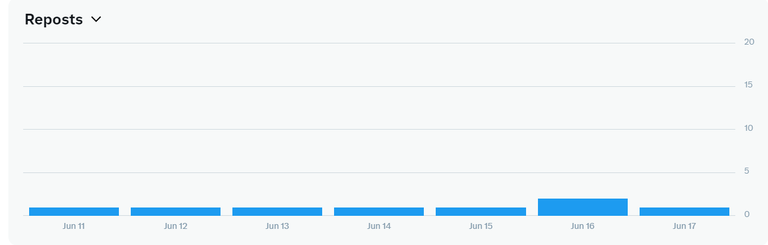
Reposts also remained steady throughout the week. Every day resulted in at least 1. One day, June 10, there were 2 retweets.
While these granular reports are appreciated, I do miss seeing top posts for the week. It doesn't appear X has given us those numbers back. Maybe next week?
Posted Using InLeo Alpha