I'm back for another X Blue metrics report. This week, I fully expected impressions to fall. I was traveling and didn't have much time for posting or scheduling posts. In fact, I left Texas on Monday afternoon, drove all day Tuesday and Wednesday, and arrived in Pennsylvania on Thursday. I've been busy with family since then. Therefore, it seems logical that, with lower content output, impressions would fall. And they certainly did!

As you can see, they fell by 39 percent, down to 2,302. That's still pretty close to my average number of impressions.
While impressions declined, engagement shot up 38 percent, to 5.2 percent. That's an outstanding engagement rate.
Other metrics that went up this week include:
- Profile visits increased by 7.7 percent, up to 14
- Link clicks shot up 250 percent, up to 7
- Replies went up by 7.7 percent, to 14
Metrics that moved downward, besides impressions, include:
- New followers fell by 12 percent, to 7
- Likes dropped 55 percent, to 29
- Reposts decreased by 18 percent, to 9
- Media views slid 20 percent, to 4
Now, let's look at the more granular numbers.
Impressions and Engagements
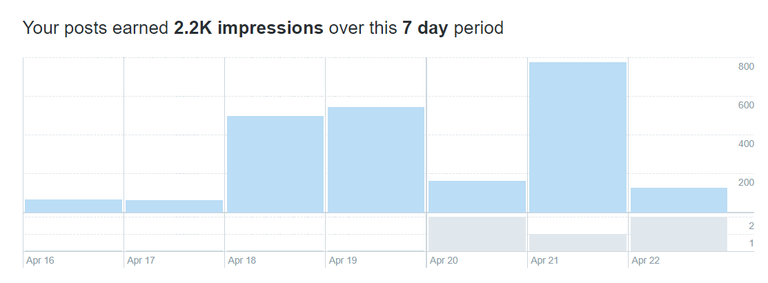
Over the last 7 days, my posts saw 2.2 thousand impressions. What's interesting is the up-and-down roller coaster ride. Impressions were down to 67 and 63 on the two days I traveled all day. But on Thursday, April 18, when I traveled for only half the day, impressions went up to 496. The next day, they were up again, to 545. They went down again on Saturday, April 20, to 165. On Sunday, April 21, they achieved the highest views at 774. It appears that the more I post on specific days, the higher my impressions go. There's nothing earthshattering about that observation, of course.
The really surprising metrics are this past week's engagements.
Engagement rate was a hefty 5.5 percent. The best engagement rate was on Wednesday, April 17, a day I traveled all day and therefore spent little time on platform. Engagement rate on that day was 9.5 percent. The next day, engagement rate fell to 7.7 percent. Again, I traveled all day and spent little time on social media. On Saturday, April 20, my post engagement rate was 7.3 percent. Engagement rate was 4.5 percent or higher every day this past week except for yesterday and today.

Link clicks this week averaged 1 per day, but 4 of them were on Sunday, April 21. Unfortunately, X's analytics reports don't tell me which links were clicked on.
Retweets also averaged 1 per day throughout the week, but they were spread out throughout the week. Posts saw at least 1 each day and 2 on Thursday and Friday, April 18 and 19.
As far as Likes go, my posts saw 28 this past week, an average of 4 per day.
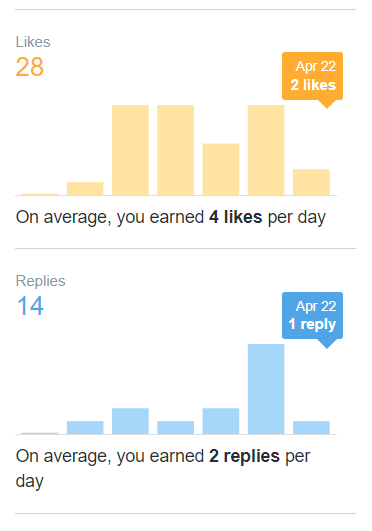
The highest number in one day was 7, on three different days: Thursday, April 18; Friday, April 19; and Sunday, April 21.
Replies averaged 2 per day with the highest number, 7, occurring on Sunday, April 21. The total for the week was 14.
Top Posts
The post this week with the highest number of impressions saw 110 views. It was published on Thursday, April 18 and featured tips on what to do with cryptocurrency earnings from social media platforms like Hive. The post was repurposed from Hive after being published first at my Paragraph newsletter/blog.
The post with the second highest number of impressions achieved 40 since its publication on Thursday, April 19. A short post announced the publication of the Garden of Eden anthology as an audiobook.
The reward for the third highest number of impressions this week goes to a post about selling books at Kroger in Mesquite, Texas. The post was published on Saturday, April 20 and saw 31 impressions.
The three highest engagement rates in the past 7 days were 20 percent, 14.3 percent, and 7.5 percent. These were for posts about the republishing an X analytics report from the week before, published this morning, the kingdom of God published on April 18, and the aforementioned post about the audiobook, respectively.
In terms of raw engagements, the post with the most impressions also had the highest engagements at 4. Likewise, the post with the second highest number of impressions also saw the highest number of raw engagements at 3. Two posts tied for third.
The kingdom of God post and the post with the third highest number of impressions both saw 2 raw engagements.
Well, that's my report this week. Maybe I should travel more often. :-)
Posted Using InLeo Alpha
You’re doing pretty well despite your busy schedule and that’s good.
Thank you. Doing my best.
Congratulations @allentaylor! You have completed the following achievement on the Hive blockchain And have been rewarded with New badge(s)
Your next target is to reach 83000 upvotes.
You can view your badges on your board and compare yourself to others in the Ranking
If you no longer want to receive notifications, reply to this comment with the word
STOPCheck out our last posts:
Your X Blue Analytics Report showcases some intriguing trends in profile visits doubled. Also for more interesting analytics, I recommend AppMetrica https://appmetrica.yandex.com/about. Its user-friendly interface was a breeze to navigate, a true boon for someone like me who isn't overly tech-savvy. The no-code integration was a relief, saving time and sparing me the steep learning curve usually involved.