As expected, my metrics fell again this week. I spent much of the week on family activities because one of my daughters got married on Saturday. That meant I had less time for social media posting, writing blog posts, and other normal business activities. I'm surprised I had time to do what I did.
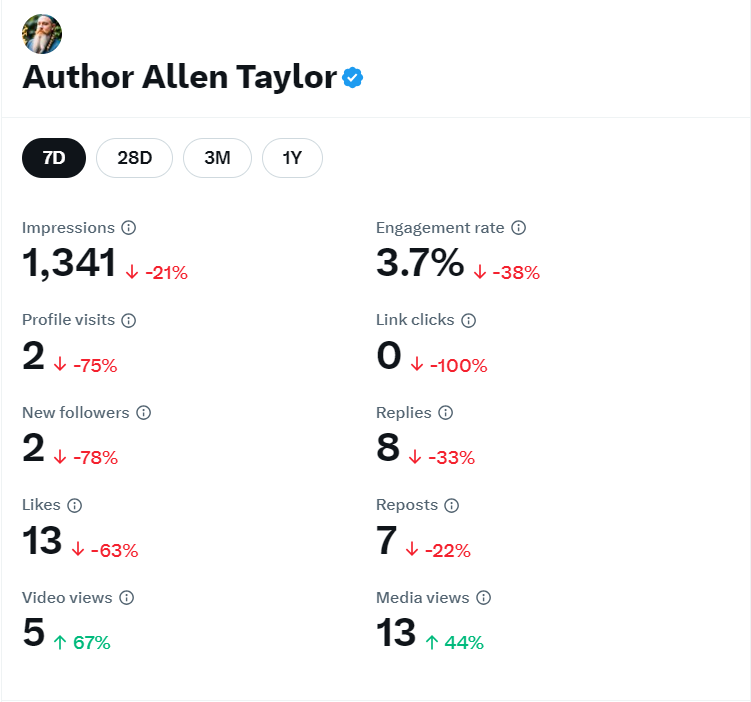
As a result of the week being busy with family stuff, almost every metric declined this week. Only two, video views and media views, increased. I find that odd in itself because I didn't post any videos and only a few memes here and there. Most of those views were likely from automated repurposed content.
Nevertheless, I still managed more than 1,000 impressions on my content and a 3.7 percent engagement rate.
Now, let's look at the granular data.
Impressions and Engagements
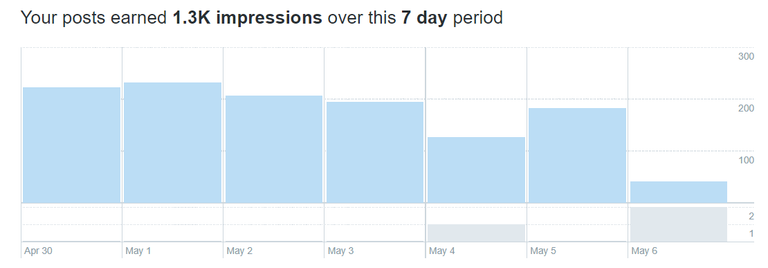
As you can see from the below graph, my 7-day impressions were steady up until today. The reached a peak of 232 impressions on Wednesday, May 1. Besides today, when impressions have been 41 so far, the lowest day was Saturday, May 4 when my posts saw 127 impressions. Three days were over the 200 mark. The aggregate number of impressions for the week was 1.3 thousand, and the average was 172 per day.
The engagement rate was a different story. Over the last seven days, ER was 4.2 percent. Today, so far, it has been 14.6 percent, the highest for the week. The lowest was 0.5 percent, which occurred yesterday. Only one other day saw an engagement rate of more than 4 percent. That was Friday, May 3 when ER hit 4.1 percent.

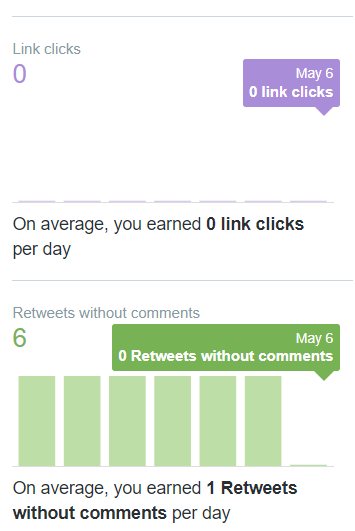
Link clicks this past seven days were nil.
Retweets without comments averaged 1 per day.
Now, I need to go about my business of improving these metrics.
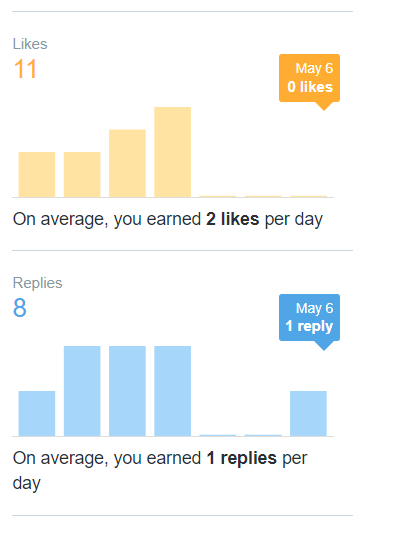
Likes averaged 2 per day this week and registered 11 aggregately. The best day for likes was May 3 when my posts achieved 4. Over the weekend, posts saw no likes. I guess people were busy with Cinco de Mayo.
Replies averaged 1 per day or 8 total for the week.
Now, which were my most popular posts this week?
Top Posts
The post with the most impressions only received 45. The second and third saw 36 and 33, respectively. These were the top 3 posts by impressions this week:
- Published May 1, a long post on the bitcoin halving was repurposed from https://inleo.io/.
- Published April 30, the previous week's X Blue Metrics Report, also repurposed from https://inleo.io
- Published May 4, a satirical meme about loving Jesus achieved some popularity
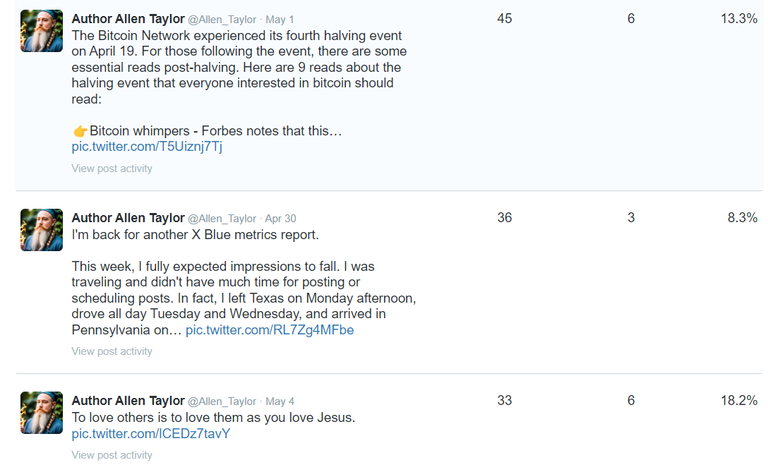
The posts with the highest engagement rates in the last seven days include the above-mentioned satirical meme with an 18.2 percent ER; a post published this morning repurposing last week's X Blue Metrics report from https://inleo.io, which achieved a 16.7 percent engagement rate; and the post with the highest number of impressions, which achieved an ER of 13.3 percent.
The X posts with the highest number of raw engagements over the last seven days include:
- The bitcoin halving post (tied with 6 raw engagements)
- The satirical Jesus meme (tied with 6 raw engagements)
- The post with the second highest number of impressions (3 raw engagements)
The overall top posts for this week was a tie between the bitcoin halving post and the satirical meme. The former ranked first impressions and raw engagements (tie with the satirical meme) and third in engagement rate. The latter ranked first in engagement rate and tied for first in raw engagements but ranked third in impressions.
Come back next week for my next report to see which metrics improve. Now it's time for me to begin scheduling social media posts to see how I can influence my metrics for the next week.
Posted Using InLeo Alpha
congrats on your daughters wedding. May her new family be blessed.
I’ve given up on subscriptions for Twitter blue for now, I’ll rather focus on InLeo premium.
I'm sure you have your reasons. I'm narrowing my focus to Hive, as well, including InLeo premium. I'm about to drop some of my other Web3 social media platforms to spend more time on Hive.