How I Build My Progress Report
Data can be either Fun, Meaningless, or a complete nightmare. Trying to keep track of my Hive Activities has been all of those things at one time or another. As I continue to become more proficient at my use of Libre Office Suite CALC, it has become more fun and at time more challenging also.
I hope to show people how I build my Progress Reports and the tools I use. My primary tool is Libre Office Calc. Libre Office is an open source program and has version for Linux, Mac, and Windows.
Lets begin building.
Step 1, build the basic data sheet:
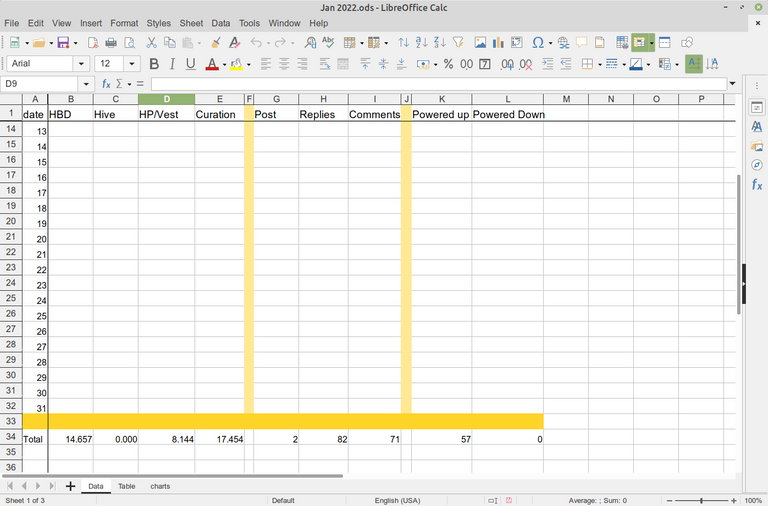
I have the top row and the first column frozen in place, as I update I do not need to worry about getting information in the wrong cell block. The top row is the information I gather. Financial info: HBD - Hive - HP/Vest - Curation , and the social info. Bottom line is the running total of the fields.
Hive task is one of the tools I gather information from. You can see why I freeze the first row and column here. There is no doubt of where i am imputing the information.
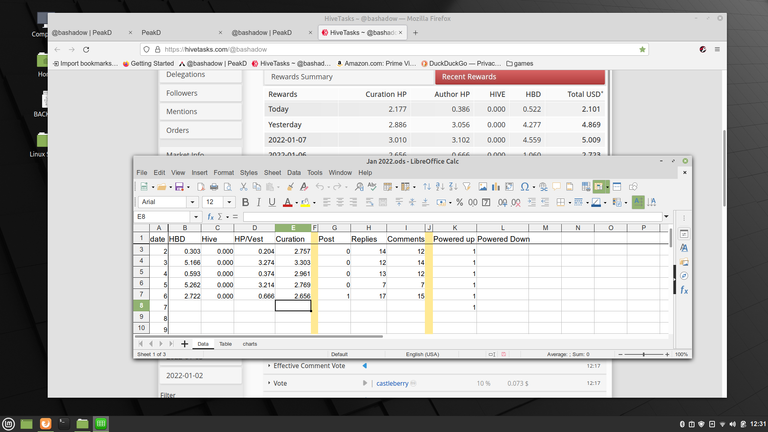
I could get the information just as easily from looking at PeakD and when I miss a day or two that is what I do. The numbers for some reason are always a little bit different, but not by much at all. I just prefer using Hive Task, (https://hivetasks.com/) since it has other information I like to look at such as how long til my vote bucket is overflowing.
After I gather my Financial data I move on to my social stats: - post - Comments - and replies. For that information I move to the PeakD Tools page.
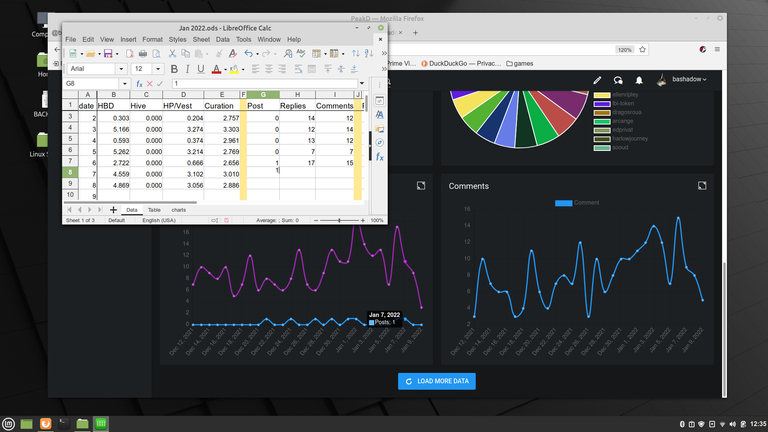
As you can see I have to shrink my spreadsheet a little bit more. With the PeakD Tools page loaded and set I then open my spreadsheet and resize it and click in the first box I will need. I generally start with the Post Column, then it is a simple matter of hovering the mouse over the appropriate dot on the PeakD page and using the key pad to input the number and the arrow keys to move to the next box on the spreadsheet.
Building the Table
The shape and form of the table is a personal choice and there are many different ways to build the primary table for your data. This works for me, I have seen some nicer ones on line, it is really a personal preference, but you have to keep in mind the ease of use by those looking at your data.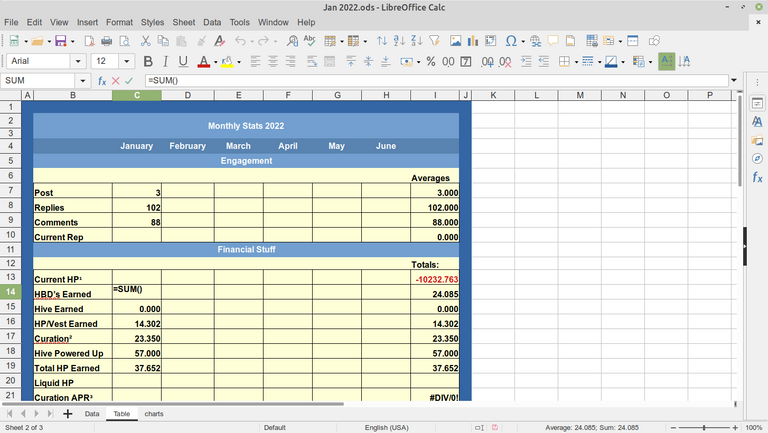
When you have your table designed it is now time to input the information into it. It would be a real pain in the arse trying to flip back and forth between the two sheets. Fortunately this only really needs to be done once and is very easy to do.
As you can see in the image above Column C is highlighted, (green), and Row 14 is highlighted. Cell C14 is the one we want to put data from the data sheet into. We click the = and it adds =sum() in the formula bar.
Next we open the Data Sheet:
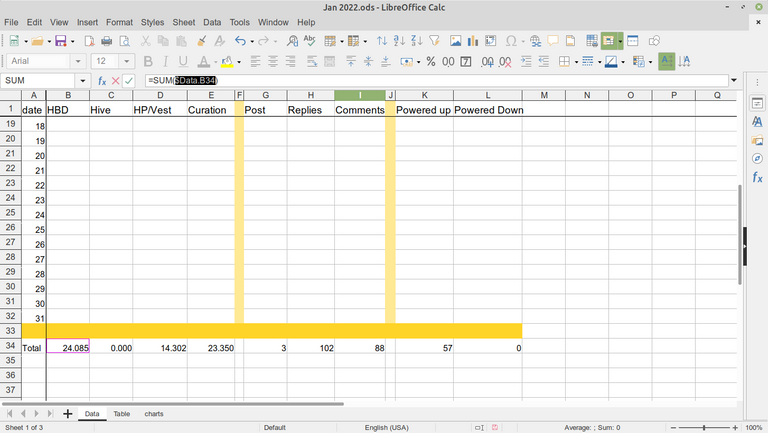
We click in the cell we want to get the data from,The total for HBD. This will put the cell link in-between the (). (SDataB34) You click the Check mark just left of the formula bar and the information becomes &DataB34 in your table cell.
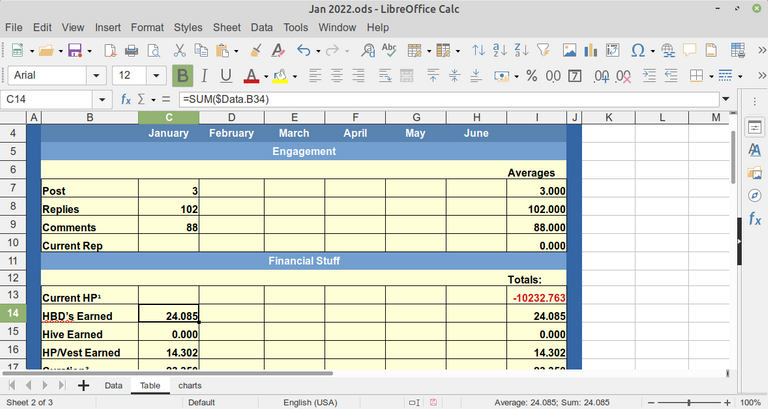
It is the same process for all the data totals from the Data sheet you want to import. The table data will automatically be updated as you enter information or change information on the primary data sheet.
When the month is done I make sure I have the sheet saved, then I copy and paste the formulas from the just published month to the new month. I also need to remember and type the published month info over-writing the formula with just the number. If I forget I can always look on line and fix the table later. With the formulas pasted I save the table as the new month.
That is pretty much my Data/Table building process. Next the charts section.
Charts
I use a few different charts and they are not that hard to build or update in Libre Office.
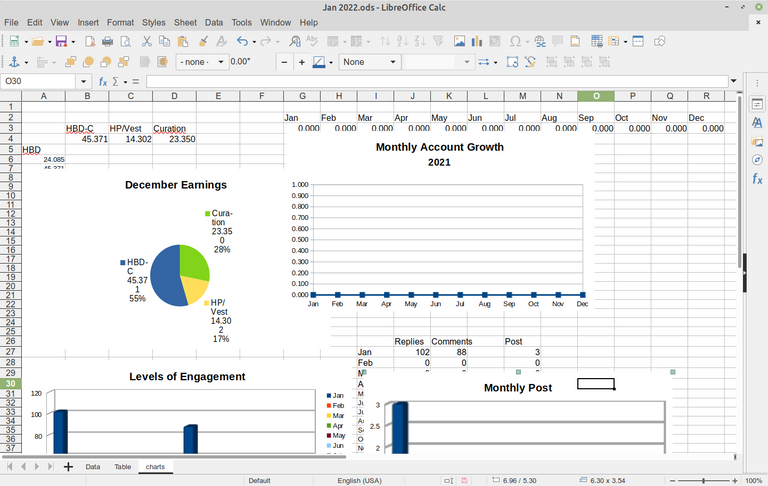
Lets start with the Pie Earnings Chart. HBD and Hive are two different tokens and have two different values, I think everyone knows that. to make an Apples and Apples comparison we need to convert the HBD's to Hive Value.This is going to be just an estimate because it would be info overload to keep track of each and every HBD price change as HBD's are earned for me.
So at the end of the month I convert the HBD's to HBD-C in my pie chart. I use the Hive wallet market to make the conversion, I just type in the HBD amount and get the equivalent of Hive. You may notice that Hive is missing, we do not earn Hive very often, and as soon as some Hive is earned I will add that into the chart also.
Monthly Account Growth
This charts data is linked to the information I input on my table using the same method as building the table data. There are a few end of the month things that need to be added to the table. You might have noticed the red number in the Current HP row, that is the base number starting point for this year, it is last years ending total. Levels of Engagement and Monthly Post follow the same method of input.
Hive engagement League Data
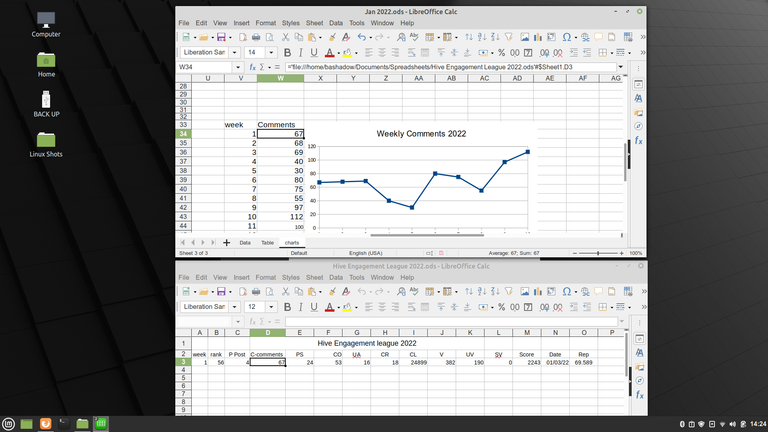
I have been a user of @abh12345's Hive Engagement League for a very long time, I think I joined around week 8 of its beginning. I have a separate spreadsheet for tracking my progress there. Since I joined there has only been one week I did not make the top 100 list, so for his league to be useful for you, you need to be active.The Hive Engagement League first post of 2022. As the year progresses the chart will expand for January it will be pretty small. The info in the screen shot is just make believe so you can get an idea of how it will look at some future date.
The data input for this chart is almost the same as for other auto data input. You click the box you want the data to display in, then click the = sign then move over to the totally different spreadsheet, click the data you want to import. The first time you will get an error, that is no problem just click save and close and then reopen the data receiving page you were working on. You will have the option pop up to allow updating, click yes and the information will be imported.
The Remaining information:
I obtain my reputation rating from HiveTask, and input it at the end of the month.
The Curation APR is derived from Hivestats(https://hivestats.io/@bashadow) page. A very useful page just change my name to yours and look around, provided by the people at LEO.
Current HP, Liquid HP and Powered up stats are from the PeakD wallet.
All the above are end of month numbers and entered the day of posting.
Any questions feel free to ask.
This post came about because of interest from @tdctunes a newish user of Hive.
Links:
Libre Office Suite https://www.libreoffice.org/
Hive Task https://hivetasks.com
LEO HiveStats https://hivestats.io/
The Engagemnet League https://peakd.com/hive-167922/@abh12345/the-hive-engagement-league-27xyyk
I use the tag #progressreport on all my monthly updates. I hope more people begin using it.
this helps me A LOT with collecting data on my account and how I am doing on Hive, you are the first post I reblogged because I am going to put a lot of the things from your post to use in my own Excel, thank you very much.
Sometimes we just need a starting point, I am glad I was able to help.
There are a lot of tools but most of it generally seems like a bit too much effort to keep track of. There was a tool recently that made my efforts of keeping track of things a lot easier. It gives you things by the monthly though.
https://hivedata.live/totals
Posted Using LeoFinance Beta
I'll have to take a look at that in the morning, thanks for the information.
This hivestats.io is a great link to share, thank you! Really interesting post too. I think I'll have to look into the Engagement League. Sounds right up my street🙌
The Engagement League is what first led me to wanting to track my progress. Asher had all the things there in the weekly report, and I had just started playing with spreadsheets, so it really helped me get going and to stay motivated.
Hey this is super interesting and helpful - thank you! I've bookmarked it and for my next update will look at doing my own spreadsheet - maybe even with a chart/graph!
Thanks again!
!PIZZA
There are a lot of different ways/techniques to keeping track, glad it will help as a starting point.
Very handy, I am going to put this on my task list I've got going in ObsidianMD as something to build out
I am glad you found it a handy post, thanks.
PIZZA Holders sent $PIZZA tips in this post's comments:
pixresteemer tipped bashadow (x1)
@tdctunes(4/15) tipped @bashadow (x1)
You can now send $PIZZA tips in Discord via tip.cc!
Thank yo. I do appreciate the assistance ingrowing my account.