Streamlit is an open source library to that makes building data apps in python quick and easy. It is free and all in python. It is designed for those who work on machine learning or data analysis using python. This enables users to quickly build and share such apps without any front-end experience. I tried it. It works. It is great. For details on Streamlit, documentation, tutorials and demo visit Streamlit website.
Getting started with Streamlit is really easy. Go the the terminal or command prompt and pip install streamlit as following.
pip isntall streamlit
Once it is installed, we can run the following.
streamlit hello
This will open up the demo web app in the default browser. This means Streamlit is installed properly and it works. Now we are ready to build our own app, all in python. Once our python code is ready, we simply run the following in the terminal and app opens up in the default browser.
streamlit run my_first_app.py
It took about ten minutes to write the following simple script that takes stock or crypto symbols as input and displays prices and charts in a web app. I just did this as test to see how it works. Try it yourself, see if you like it. If you do like it read their tutorials and documentations. They are really well written and easy to get started.
import streamlit as st
import numpy as np
import pandas as pd
import yfinance as yf
import datetime as dt
from pandas_datareader import data as pdr

stocks = st.sidebar.text_area('Stock Symbols:', 'BTC-USD')
stocks = stocks.split()
days = st.sidebar.text_input('Days:','365')
days = int(days)
button_getStocks = st.sidebar.button('Get Stocks')
end_date = dt.datetime.today()
start_date = end_date - dt.timedelta(days=days)


def getStocks(stocks, start_date, end_date):
    yf.pdr_override()
    for stock in stocks:
        df = pdr.get_data_yahoo(stock, start_date, end_date)
        price = stock + ' -  ' + str(round(df['Close'][-1],2))
        st.write(price)
        st.line_chart(df['Close'])

if button_getStocks:
    getStocks(stocks, start_date, end_date)
This is how the output looks on the browser.
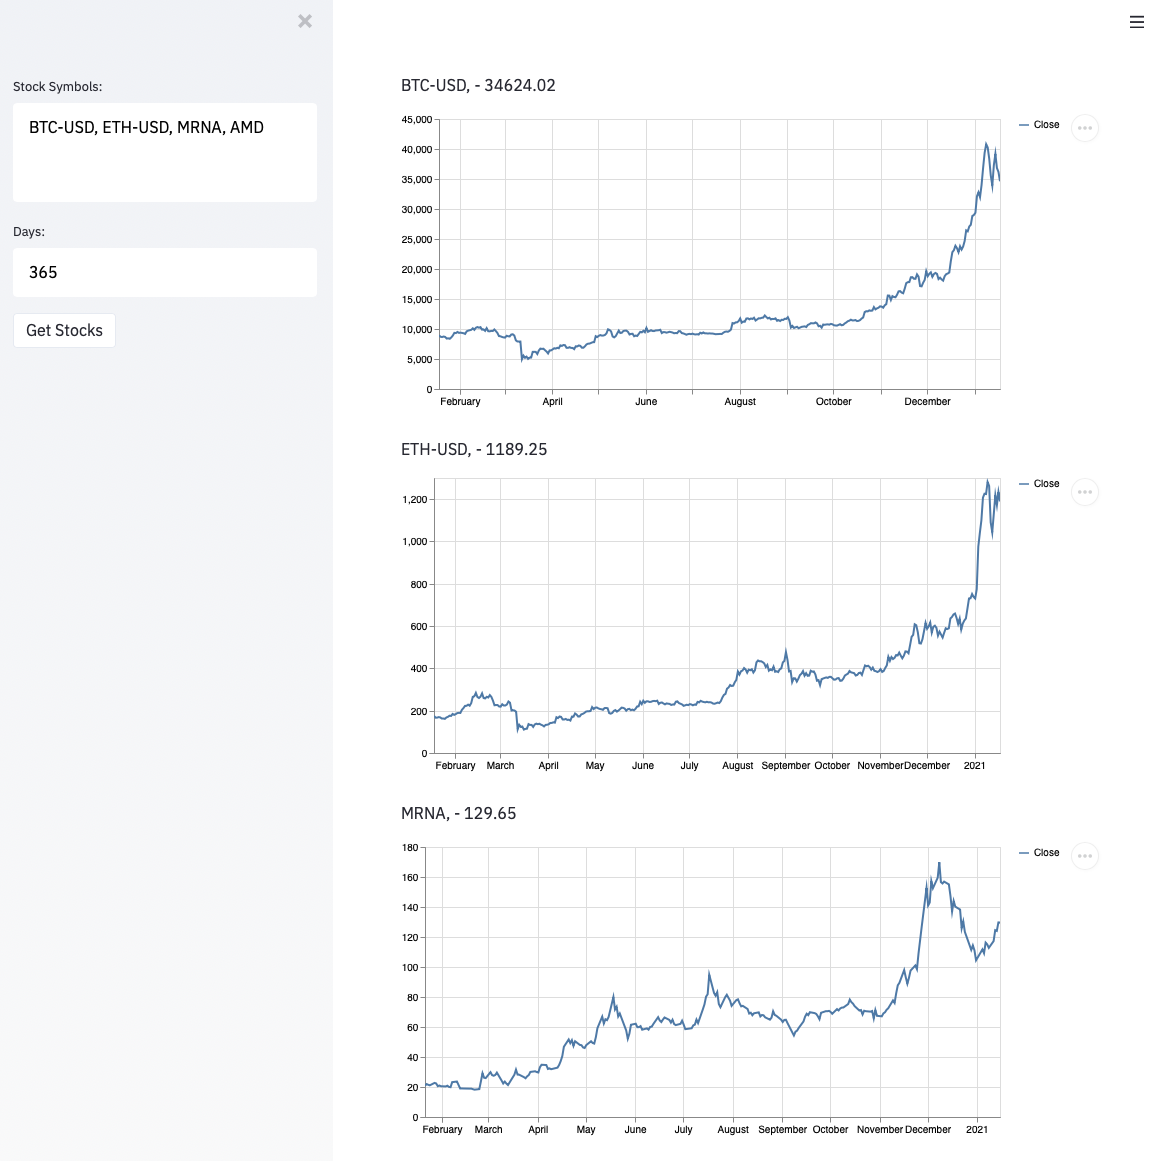
Nothing fancy. But it works. I am sure with some more thought and adding more code we can come up with some useful and better looking app.
What is really great about Streamlit is it makes sharing the apps easy. They offer sharing on their platform. Moreover, these apps can easily be deployed to Heroku as well.
Posted Using LeoFinance Beta
Considering the fact that it took 10 minutes to write the below script, I still think it came out nice on the output look from the browser. With some more coding it could be even better. Been a while @geekgirl, seems you haven't been on here that much lately?
Posted Using LeoFinance Beta
Thank you @josedicuss. Yes, I haven’t been posting much lately. I hope everything is great with you.
It's all good with me, surviving in covid-19 times isn't really a pleasant task but then we are grateful to be alive nontheless.
Posted Using LeoFinance Beta
The output looks really pleasant. Thanks for sharing .
You are a programmer. RIGHT??? I don't know much about programming.
I don’t know much either. I just try to learn sometimes.
Good wishes for learning programming.
It is completely free and easy to use. Thank you for sharing content about the app.
You are outstanding.
Posted Using LeoFinance Beta
Congratulations @geekgirl! You have completed the following achievement on the Hive blockchain and have been rewarded with new badge(s) :
You can view your badges on your board and compare yourself to others in the Ranking
If you no longer want to receive notifications, reply to this comment with the word
STOP