Hey Everyone!
I was looking at some of my old posts on Steemit and found one that explains the QFL (Quick Fingers Luc) trading strategy. Instead of writing all the same things again, I thought I would edit and repost it below. Although it concentrates on the Steem chart, it is a good example of the method and can be applied to any coin. I mention the 1 hour charts below, but the 4 hour is even more reliable.
So here is the article I wrote back then...
After learning and testing Quick Fingers Luc's method, I can honestly say the QFL trading stategy has given me confidence that it is, at the minimum, 90% accurate on most coins (the losing 10% was always my own FOMO and FUD!. Here I will be looking at the Steem chart to demonstrate how it works.
Main Points For This Strategy
We are looking at hourly candles on the chart within at least a 2 month period and trying to find where there has been a big bounce UP within a short time or the price has been going sideways and continuously testing a support line.
When there has been a bounce we draw a line at the bottom of the bounce. That becomes the new “BASE”.
Now we wait for the “base” to be broken by a candle during a panic sell. A panic sell is when the hourly red candle suddenly drops below the base and continues down in the next few candles.
Once the price is below the last “base” price it is safe to start buying as within a few hours / days it will return to the base at which point we already have a sell order placed.
Now we should wait for the price to be at least between 5% or 10% below the base to start buying. Our first buy will be a small one (a nibble as Luc calls it) and allowing for it to drop lower so that we can double our first buy amount if it does go down.
Once our buy order has been filled we can set a sell limit order at the price of the last base (or slightly lower to be safe) and now just wait for the price to retouch the base. To accumulate free coins, we can just sell the same amount that we initially invested and keep the profit in “free coins”. So, for instance, you invested $100 and you made a 20% profit, then you sell $100 at the target and keep $20 in the traded coin.
Here is the current Steem chart showing how safe these trades are.
Green lines = Bases which have been successful (extends to where the sell order would have executed)
Yellow lines = Bases which have not been broken by the price going lower.
Grey box = Just one example on this chart of when the price fell below the last base (green line) and returned to it within 3 days netting a profit of around 20%. Anywhere in the grey box would have been a “safe” buy.
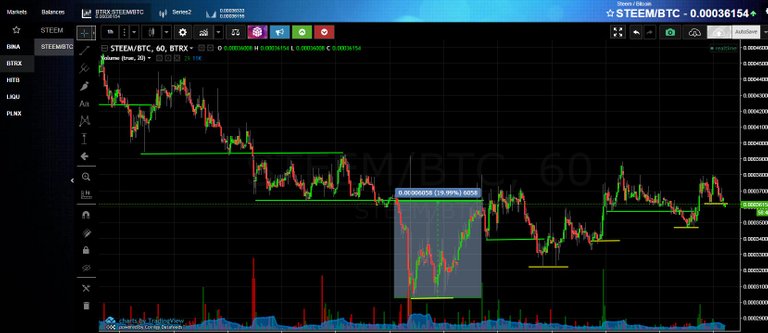
As you can see any purchases below the last base would have been a success!
I hope you will follow my posts, vote and all that! We will see how successful this method is or if not please remember that I am not a financial advisor and any trades you take using this method are at your own risk.
Also, last but not least, I highly recommend you watch the quickfingersluc videos. They explain it all much better than I can and with lots more examples. I started with this video:
Posted Using LeoFinance Beta
Congratulations @ladycrypto! You received a personal badge!
You can view your badges on your board and compare yourself to others in the Ranking
Check out the last post from @hivebuzz: