It's been a while since I discussed these subjects: Bitcoin technical analysis. So, I figured it might be a good moment to detail my market perspective and potential chart-based scenarios. My primary interest lies in chart data exclusively.
Yes, I am a chartist. 😁
Before delving into the intricacies of this asset and potential other factors, I must emphasize that this is not investment advice. With that being said, let's explore this complex world that often leads to confusion.
Why do I mention the Bitcoin Landscape? Because every trader needs to study the chart from the broader perspective to the detailed one. This means analyzing higher timeframes (such as the monthly chart) and then progressively moving to smaller timeframes, based on the trading style used.

In this chart, I present the tools I use for analysis:
1 - Fibonacci Retracement
2 - TDI + RSI Divergence Indicator
3 - Volume
You wouldn't imagine how revealing that "dumb" volume indicator is until you read this book.
A Complete Guide To Volume Price Analysis: Read the Book... Then Read the Market by Anna Coulling.
Please read the book. 🙏
I will highlight a simple point to remember. This chart is monthly, with each candle representing a month of trading. Look at the candle bodies and volume bars for each one. You will see that a change in market direction occurs when there is a discrepancy between them.

In the first two candles marked we see long bodies but with no significant volume, indicating a potential market reversal. The other two marked candles show small bodies with high trading volume, leaving the outcome open to interpretation.
😂
Not so open ... did you see what happened?
Now let's move on to the present time when there are only 9 days left of this month.
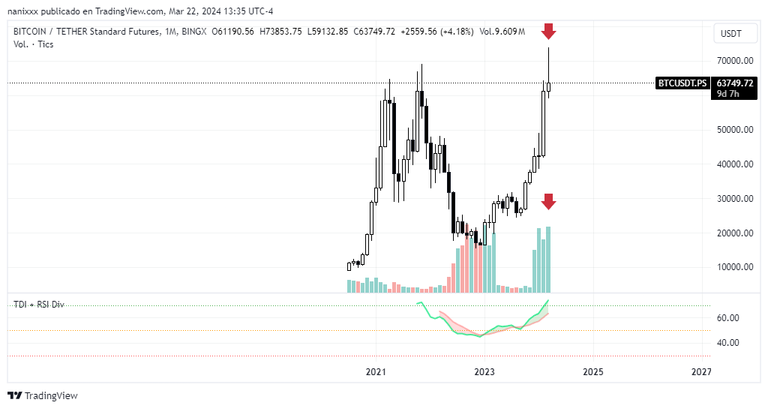
I repeat: this is not an investment recommendation, but the market tells me that there is a lot of volume and a small body for that candle, so BTC is likely to see new highs in the coming months. Also, let's think logically, with this new bull run that previous ATH would be broken as timidly as it has. Well, I don't think so.
The significant increase has created a market imbalance that can potentially be restored through a natural process.

The price will eventually have to touch that marked area. Don't be scared.
Knowing this, all my trades will be in long positions, but we need to determine the entry points. To achieve this, we need to focus on smaller time frames and examine more basic elements; it's nothing extraordinary.
 I am concerned about the divergence between the TDI indicator and the chart. The price is likely to decrease in that area, but this movement will not occur immediately. It may take several months to reach around 20K on the daily chart.
In the chart below (daily candles), I identified an accumulation zone, also known as sideways movement, where a order block caused a breaking zone. I have also highlighted (as it is clearly visible) the significant imbalance present in that area. It is expected that the price will eventually move towards that point.

We are on a daily chart, remember. Since there was a break of structure (the sideways movement that BTC was experiencing) and a quite strong upward momentum that has been driving the price lower, I will measure with Fibonacci.

With this tool, I will determine entry prices for my trades at levels of 50%, 61.80%, and 88%.
You might be wondering: if you anticipate a downturn, why not capitalize on short positions? While a valid point, going against the trend is risky and requires significant expertise. I might consider it, but would need to exit swiftly to avoid being caught like I was during this upward push.
🤷🏻♀️
But I need to zoom out more to see what's happening in more detail.
4 hour candles.
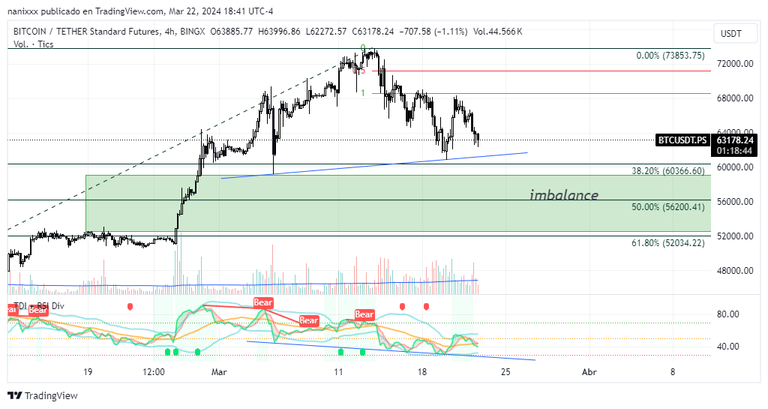
Do you see the divergence between the chart and the TDI indicator? That's not the one I pointed out above. Is another. But I assure you that those candles will fall to correct that divergence. So I can confidently expect my entries at the prices I have marked. These are:
56200.41
52034.22
and... 42783.87 (This will take a while, I don't think it will be achieved soon.)

At the moment, and according to my analysis, I am already noticing an increase in trading volume and a small candle body, they could indicate a change in market direction. This rise that I expect could come after correcting the divergence. And remember that this imbalance is not going to remain there unfilled. It was caused by excessive purchases and few sales and this has to be balanced.
Now I'm going to mark these important prices on a 1hr candlestick chart and see what's going on there.
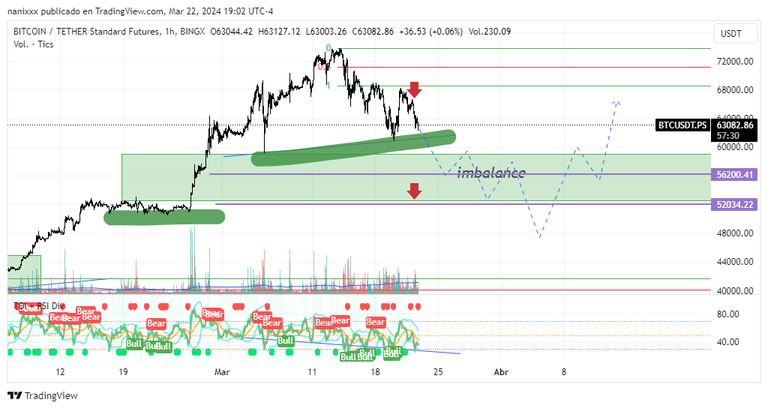
I don't have a magic ball and this is all a prediction. However, there are things that I can assure and one of them is, for example, that in areas of the chart where you detect that the price touched several times, it is one of those areas that is there to be drilled. I pointed them out to you with a green highlighter.
The good news is this:
I wanted to show you some data that was not seen from my Fibonacci.
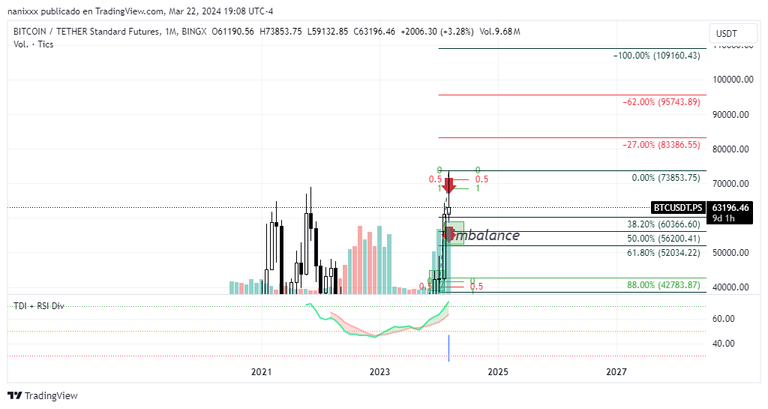 1 month chart again
The prices marked in red... (take profit) but you probably already knew that from so much that has been said, right?
For my style of perpetual futures trading, using only 3x leverage, and only risking what I can afford to lose, this analysis is more than enough for me. And until today it has been very effective.
See you at the beginning of April, let's see how this all went.
;)
Original content by @nanixxx. All rights reserved ©, 2024.
Cover image created on ausbit's stuff and things discord channel (https://discord.gg/EJJ3XUcR)
Posted Using InLeo Alpha
Puff, this crypto thing is always a mess 😅, although it could be very mechanical I suppose, I'm still with my $10 investment 😆, I'll tell you in April, Greetings ✌️
Pffff... Shiba???? It will take about three or four months to go up, well.... I have no idea of the exact time but it's not tomorrow.
No no es Shiva jjj, es un token que ha pasado por mucho, lo tengo hace cuatro años, tuvo una migración debido a un exploit ahora después de mucho esta por salir sus nuevas funcionalidades, algo parecido a lo de solana, creo que se adelantó, esperemos a ver Se llama Feg, hay mucho scam girando alrededor de este así que si lo buscas trata de estar segura que es el correcto
Ah no...yo solo compré un poco de Shiba 😄😅 porque me gusta el perrito. Y acabo de cerrar un trade en futuros con Doge. Porque es otro perrito. 😄
😂 esos perritos quedarán en la historia 😂, mira que son mencionados, me pregunto que dirán las personas de aquí a 100 años de esto 😅
Buenísimo ese libro lo estoy leyendo, he tenido que hacerlo dos veces, ya que a la primera no entendí mucho jjj pero bueno ahí vamos, al menos ya entendí que no debo sobreapalancarme 🤜🤛
Vamos a ver qué tal va este análisis... 😁