Hello friends and welcome to my blog, I am happy to be back here again and blogging in this wonderful community on hive blockchain.
I have been researching a lot about cryptos and great trading techniques that can offer cool profits to traders, this week I explored the use of zig-zag indicator in trading.
Let's explore and understand what it's all about 😎😎

ZIg-Zag Indicator
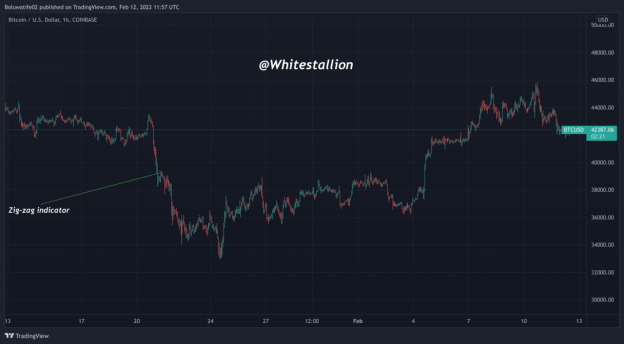
Zig-Zag indicator is a tool that is basically used for analysis and it is used by analysts when a secured trend is reversing. Price trend is something that all traders don't joke with no matter the state of the market, whether in an uptrend, downtrend, ranging market, there are a lot of different indicators and techniques that can be used to analyze the beginning of a trend. When you use this indicator with other tools like support and resistance, you may be able to ascertain the possibility of the market reversing. One major feature of this indicator is that it can blot out noise in a chart.
The Zig-zag indicator helps to eradicate, destroy and take away unstable predicted prices and also a deviation that might want to happen when a trend wants to occur. Since it is used for analysis, and it doesn't foretell a futuristic event, it is of a great use in the analysis as it helps determine the price changes and it is actually developed to identify the price change. This indicator gives a sign of the time a major trend in the market is about to change. The indicator has a lot of uses and shows necessary extremes that cannot be discovered without the usage of the indicator. Zig-zag indicators just specifically draw out the trend on the market and take a lot of confusion away from the trader, by helping the trader to get a better glimpse of what is happening in the market.
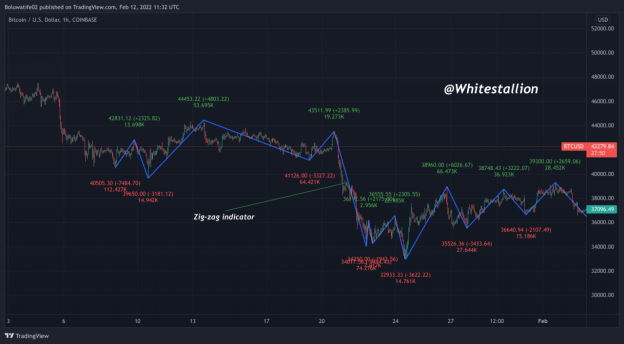
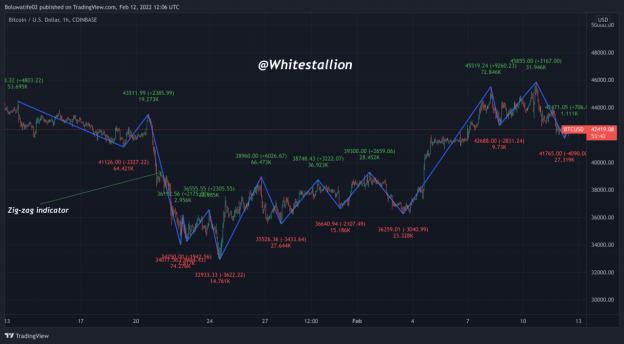
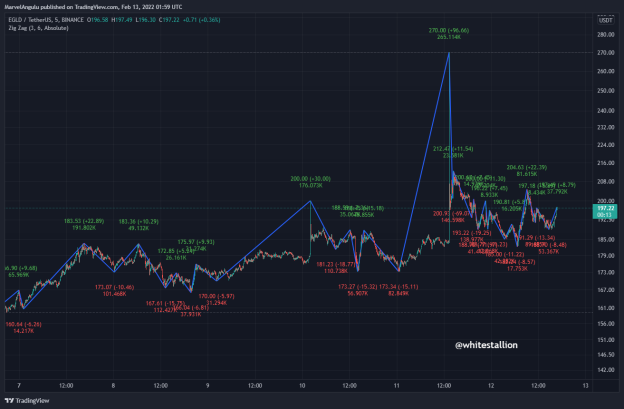
As you can see in the image below, after I applied the zigzag indicator it helped in blocking out the noise in the chart. This is because of the line that is drawn on the chart which looks like a trend line. You understand that noise in price movements are more pronounced in short time frames but in long time frames, the noise is less.
How to set up the Zig-Zag Indicator on your chart
The platform that will be used for this is called www.tradingview.com it is a website application that is used majorly for analysis.
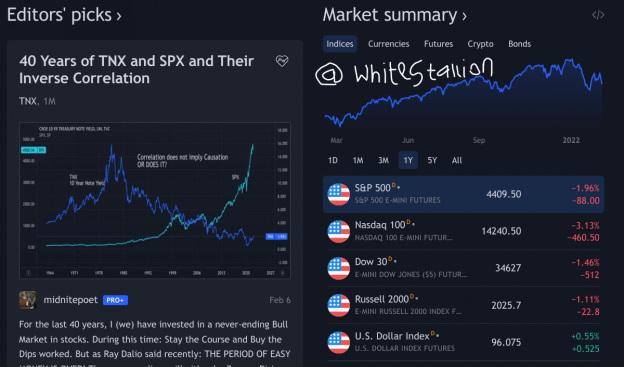
- Open Tradingview and sign in. The interface would look like the image below after signing in.
- Then go to charts, which is in the middle of the website application and click.
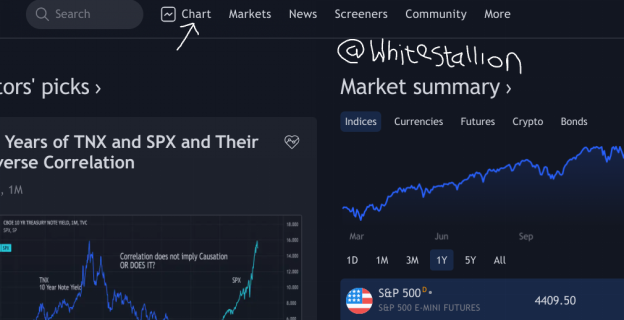
- After the chat is being clicked, the next interface will look like the image below.
- Then, afterward, there is a button at the top named indicators.
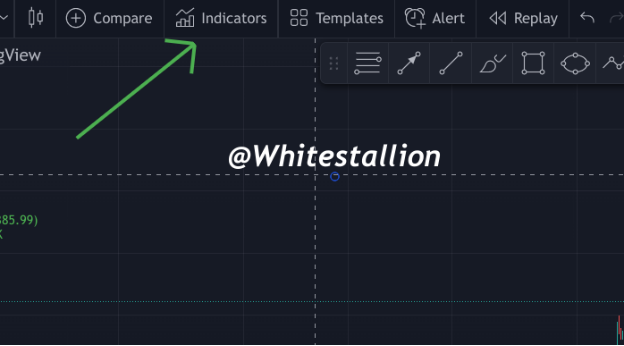
- Then, click indicators and input the Zig-Zag Indicator.
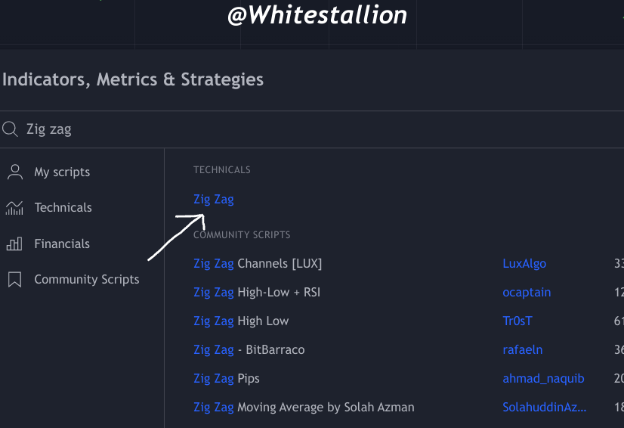
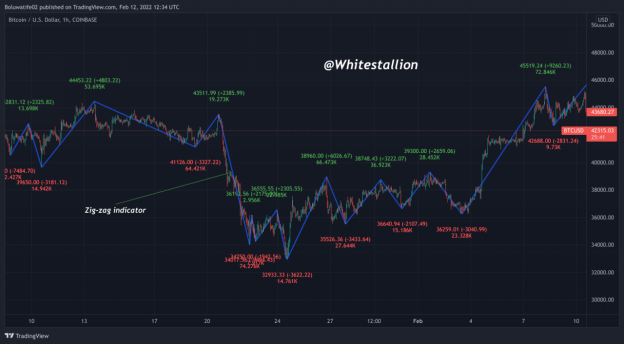
- Then it would show the Zig-zag indicator on the chart. Just like the image below.
In the setting of a candlestick, the calculation of the Zig-zag indicator means the minimum price and the maximum price. However, it is different from other charts like bar charts, line charts, and so on.
How to calculate the Zig-Zag Indicator
1.Select or know a point to start either a peak or a trough
2.Select the percentage Market pattern or price trend.
3.Locate the Next peak or trough that is different from the point in which you started which would be equal your percentage price trend.
4.Produce a trend line.
5.Continue the process.
The indicator has a formula although you won’t need to sit with a pen and calculator to run the calculations, you may need it for knowledge's sake. When using the regular candlesticks, the minimum and maximum price are taken into consideration when calculating. Once there is a deviation in price, the zigzag moves accordingly.
The formula is
The zigzag = Closing prices, minimum deviation in price action which is in percentage = value x, change from peak to trough = False, last extreme= true.
Where the last extreme is if the peak price is almost the same over many periods
Always be mindful of the fact that this indicator will ultimately perform better when you use higher timeframes as a result, in choppy or ranging trends, you may not get the best of this indicator.
It is my personal recommendation that you don’t use this indicator alone, use I alongside other indicators
** Main parameters of the ZigZag indicator and How to configure them**
On the trading view website application, the main parameters of the Zig-zag indicators are just 2 and they are mentioned below;
1.Depth: This is the lowest movement made that the indicator will not show on the market pattern or the price trend that is different from the one shown before by the merit which is the same as the deviation. The value of its number is usually placed at 10.
2.Deviation: This is the trough change in the price pattern that must have in it included a peak or trough from the peak or trough that is showed before so that the Zig-zag can locate a new peak, The percentage of this is is usually expressed and which it also have a value constantly set to be 5
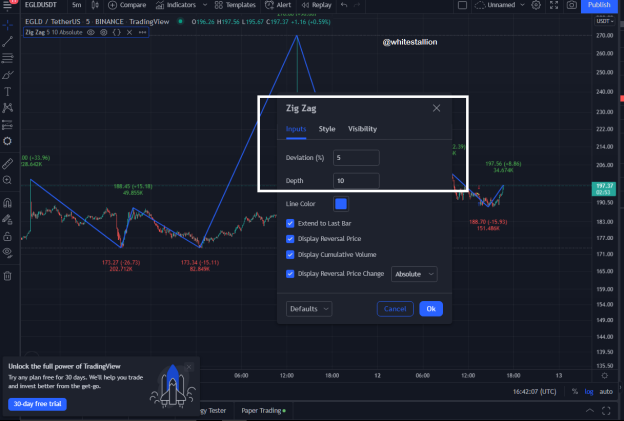
From the above chart we can see that the default is set at deviation 5% and depth 10%.
The image below will show the movements of the indicator set at deviation 3 and depth 7.
As you can see in the image nelow, there is more choppy movement in the indicator making it a little bit difficult to understand specific movements in the prices. You should only tweak the value of the settings when you are a pro trader and want to see little sensitive movements in the market
It is not so advisable to change its default setting because they have a role they play at that level.
Traders only focus on depth, which is not supposed to be, because the place of deviation has been left behind. However if a value that is too small is set for the depth, the Zig-zag line that will show on your chart will be filled with a lot of breaks that carries many unreliable trend and reversal of price.
To test this, we can use the tradeview with a different depth of 5 and 10 and compare them together to see the difference.
Depth 5.
Depth 10
Usually, you need to set the price movements or actions to use the zigzag indicator meanwhile the indicator’s default setting is 5%. If you change it to 7 it means that only deviations of about 7% are shown on the chart. What this does is to allow you see the bigger picture of the price movements.
Identifying Bullish and Bearish Trend Uing Zig Zag Indicator
The traders that use Zig-zag to determine the price trend are already professional traders and beginners, novice or amateurs won't be able to handle the level of professionalism of the Zig-Zag indicators. If the Zig-zag indicator makes peaks and troughs in an ascending order, the price trend which is also known as the market trend, market pattern or market status is in an uptrend, and an uptrend is the arrangement of the candle stick that is moving in an upward manner. So, when the peaks and through are in descending order, that is, going down, the price is in downtrend, and downtrend is the arrangement of candles in a pattern that is moving downward.
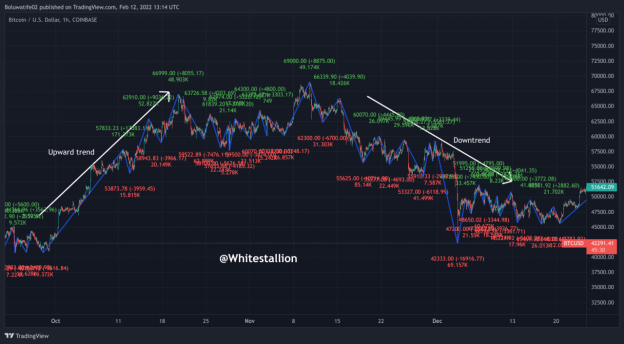
The peak that forms after is higher in comparison to those that forms before it + The trough that forms after is higher in comparison to the previous ones, then, the market is in an upward trend.
The trough that forms after is lower in comparison to those that forms before it + The next high, lower in comparison to the previous ones, then the market is in a downward trend.
The execution of a buy order in an uptrend market pattern when the price trend shows that the trough (low) that forms after is higher than the previous trough (low), then the stop loss would be below the nearest trough (low).
The execution of a sell order in a downtrend market pattern when the price trend shows that the peak (high) that forms after is lower than the previous peak (high), then the stop loss would be above the nearest peak (high).
Sell order
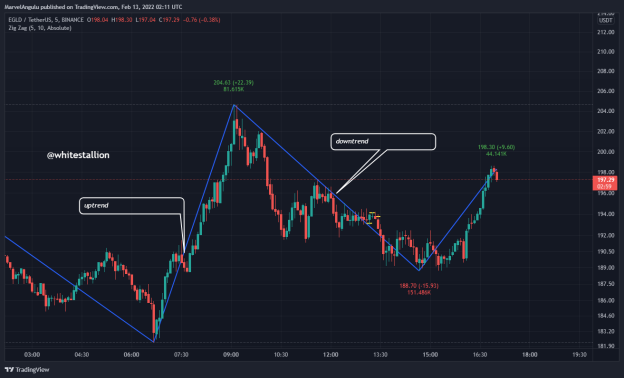
You can decide to place a sell order during a downtrend which is characterized by lower highs and lower lows. You can further make this more effective by using other tools like the Elliot 3 waves which kick in just after a last impulse.
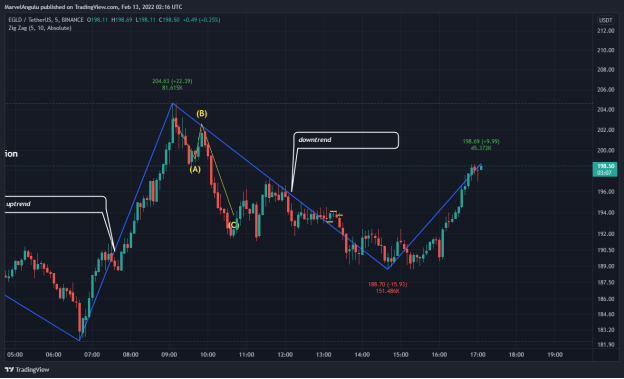
In the images above, I applied my elliot abc correction tool which give more indication that the rend was bearish, with point C being the best place to open a sell order.
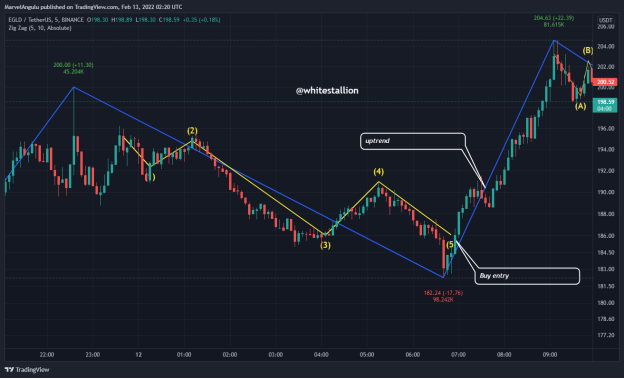
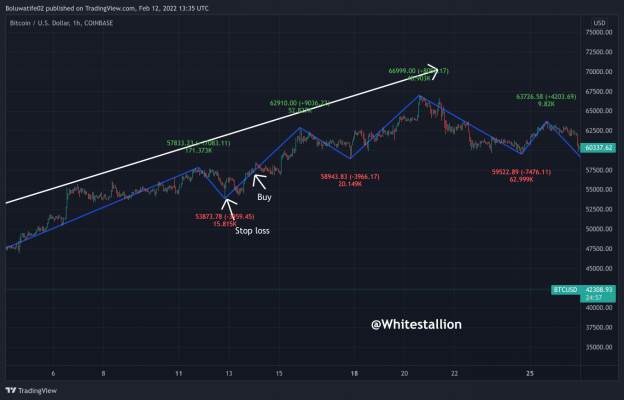
Buy order
The same principle works here as you can see, now using my Elliot 1-5 wave count, I marked the beginning of my new uptrend making it the perfect point of opening a buy order.
The examples below show the practical examples of what is explained above.👇👇

Which Other Indicators can i add to Eradicate False Signals
There is a need to combine another Indicator, together with the Zig-Zag so as to work in its effectiveness and also to produce a better result. As we know, a proper trader must know how to combine indicators because no one indicator iss very accurate alone. Atleast we require two indicators to make good trading decisions.
The Indicators that are required to combine together with Zig-Zag indicators are:
- CCI (Commodity Channel Index)
- Fibonacci Retracement.
- Elliot wave
These indicators perform different functions although they certainly work together to produce desired results as needed ny the trader. Principally, they eliminate all noise in the market
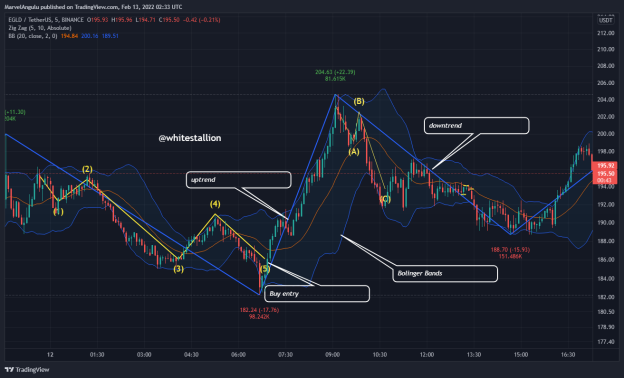
As you can see in the screenshot above, I combined Bollinger bands with my zigzag indicator. I also included my Elliot’s waves indicator to help me make proper trading decisions. The Bollinger bands help me identify support, resistance levels and trends. The all help me get rid of false signals.
Advnatages and Disadvantages Zig-zag indicators
| Advantages of the zigzag indicator | Disadvantages of the zig-zag indicator |
|---|---|
| The indicator has the ability to almost accurately point out support and resistance level of any asset thus, the former price action will help traders understand where the market is coming from. | Sometimes the indicator could give false or inaccurate results due to the nature of the timeframe used. |
| The nature of the indicator helps to trends in the prices of assets and filter the noise. | The indicator almost doesn’t give indications of the possible future direction of an asset. |
| It is an accurate indicator to analyze historical data. It helps in discovering price and market trend. Furthermore, It can give you different intensities of trend movements in percentages. | Because of its ability to give choppy movements it can confuse traders especially amateurs |
Conclusion
The Zig-Zag indicator is basically used to discover price trend, market pattern and market movement, but it lacks the strength to say the ongoing price status. As it has been discussed rightly before now, the indicator works well and rightly with other indicators such as Fibonacci level, Elliot wave and CCI, it then helps to filter the noise in the market With proper practice, one can gain more understanding of the way it works and interconnect with other indicators for proper and profitable trading practices.
Note all the images used in this post were extracted from Tradingview and edited by @whitestallion for the purpose of this post.
Why are you coming here after collaborating with the Steemit criminals?
I do not understand what you mean by collaborating with Steemit criminals, I have no idea what you mean.
I believe this is an open blockchain where I can publish my posts.
Steemit is a criminal organization and you collaborated with them in their fake community efforts after they stole my STEEM and many more millions of STEEM from others. Of course you can post here. I can vote on your posts too.
You have downvoted my post for no reason at all other than I am active on steemit??
That’s very unfair and contrary to what the hive blockchain is all about - Fair and equitable!
I downvoted your post because you collaborated with Steemit, a criminal thief organization. Don't try to pretend you have a moral compass about what's fair and equitable, unless you want to replace the millions of STEEM stolen from people by the thieves who stole Steem.
I really can't replace anything, I started a minnow on steemit and after the split, I remained inactive on steemit for more than 9 months before I started blogging again during covid.
I am sorry you lost millions of steem and funds but I just want you to understand I wasn't part of that. I am just a normal guy trying to rise through the ranks.
I hope you understand
Congratulations @whitestallion! You have completed the following achievement on the Hive blockchain and have been rewarded with new badge(s):
Your next target is to reach 800 replies.
You can view your badges on your board and compare yourself to others in the Ranking
If you no longer want to receive notifications, reply to this comment with the word
STOPCheck out the last post from @hivebuzz:
Support the HiveBuzz project. Vote for our proposal!