Hello Hivers,
Today, I'd like to share with you my technical analysis on Viacoin (VIA). As most of the altcoins, Viacoin has been in a downtrend in terms of BTC ever since the January of 2018 when it hit it's high of ~0.0005 BTC.
I'm not going to talk about Viacoin fundamentals this post (maybe I can talk about this in another post if you people are interested in it), but I'll strictly share my thoughts on technical fundamentals and why I believe Viacoin will have very successful late 2020/early 2021.
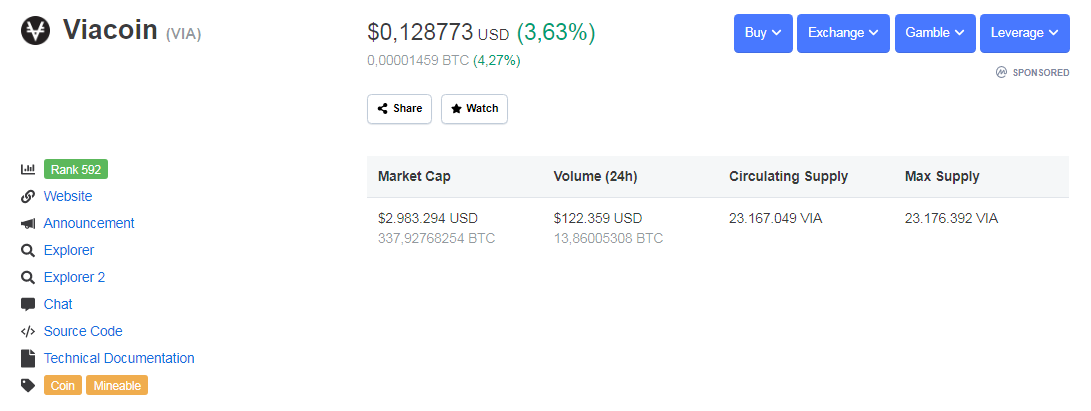
Right now, Viacoin is sitting at 592nd place on Coinmarketcap, with a market cap of ~340 BTC. Daily volume is somewhere around 10-20 BTC with occasional stronger spikes which I will talk about later on and show them on charts.
So let's zoom out and look at 1W candles with Logharitmic scale to see potential support levels and potential targets in the future.
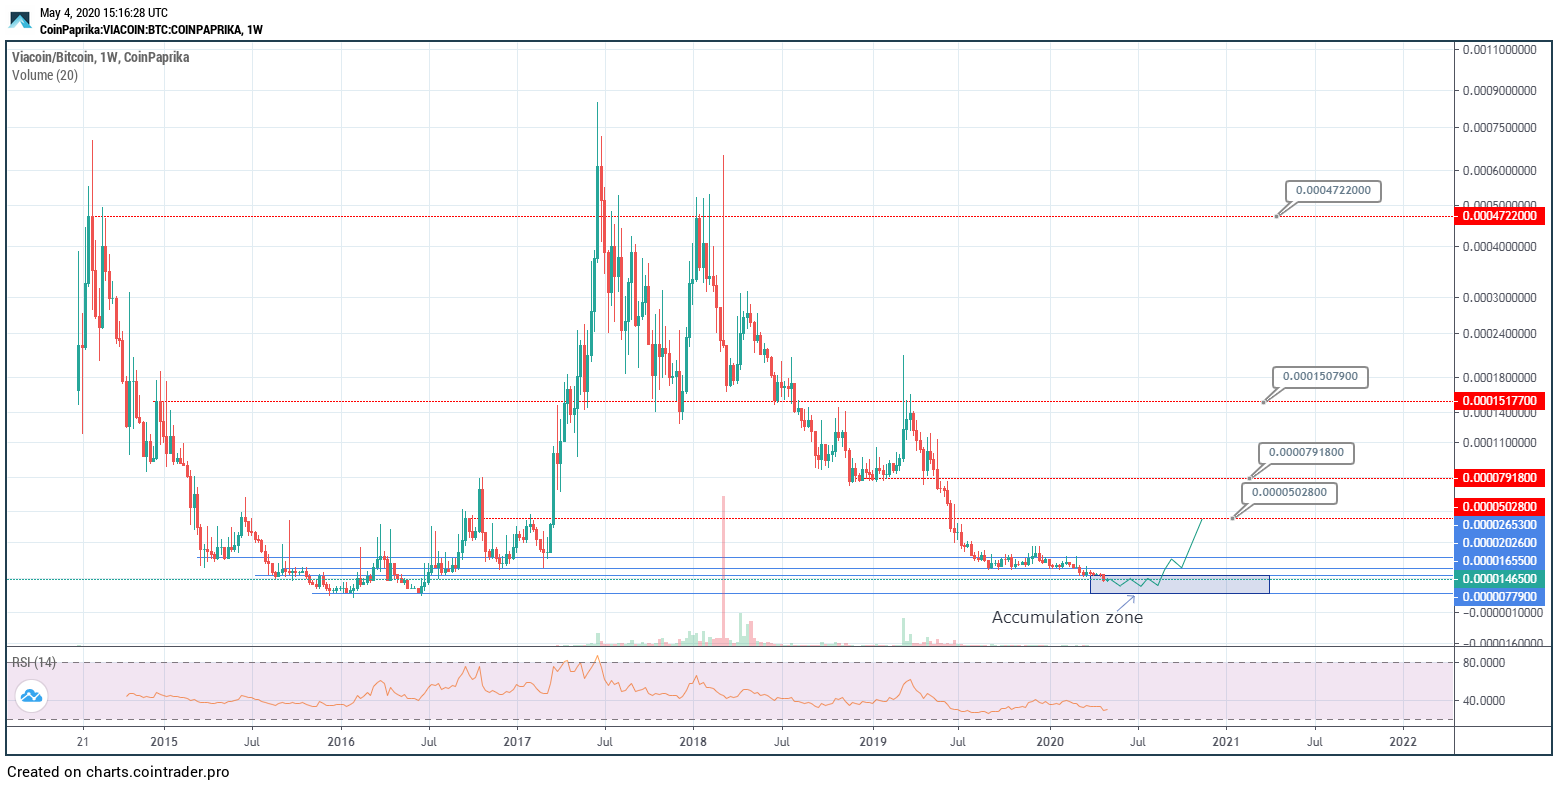
1W candles:
https://charts.cointrader.pro/snapshot/g1EWw
As it can be seen on the weekly candles, VIA has entered final level of accumulation it has continuously broken it's support levels and proceeded to reach levels close to it's all time low in terms of BTC in 2016.
This is, in my opinion, final accumulation of VIA and price might go sideways in this area between 0.00001400 and 0.00000800 BTC. On the chart I also labeled targets: 0.00005 BTC, 0.00008 BTC, 0.00015 and 0.00047 BTC. ( marked with red line)
Let's zoom in on the Daily candles to look at the current situation better.
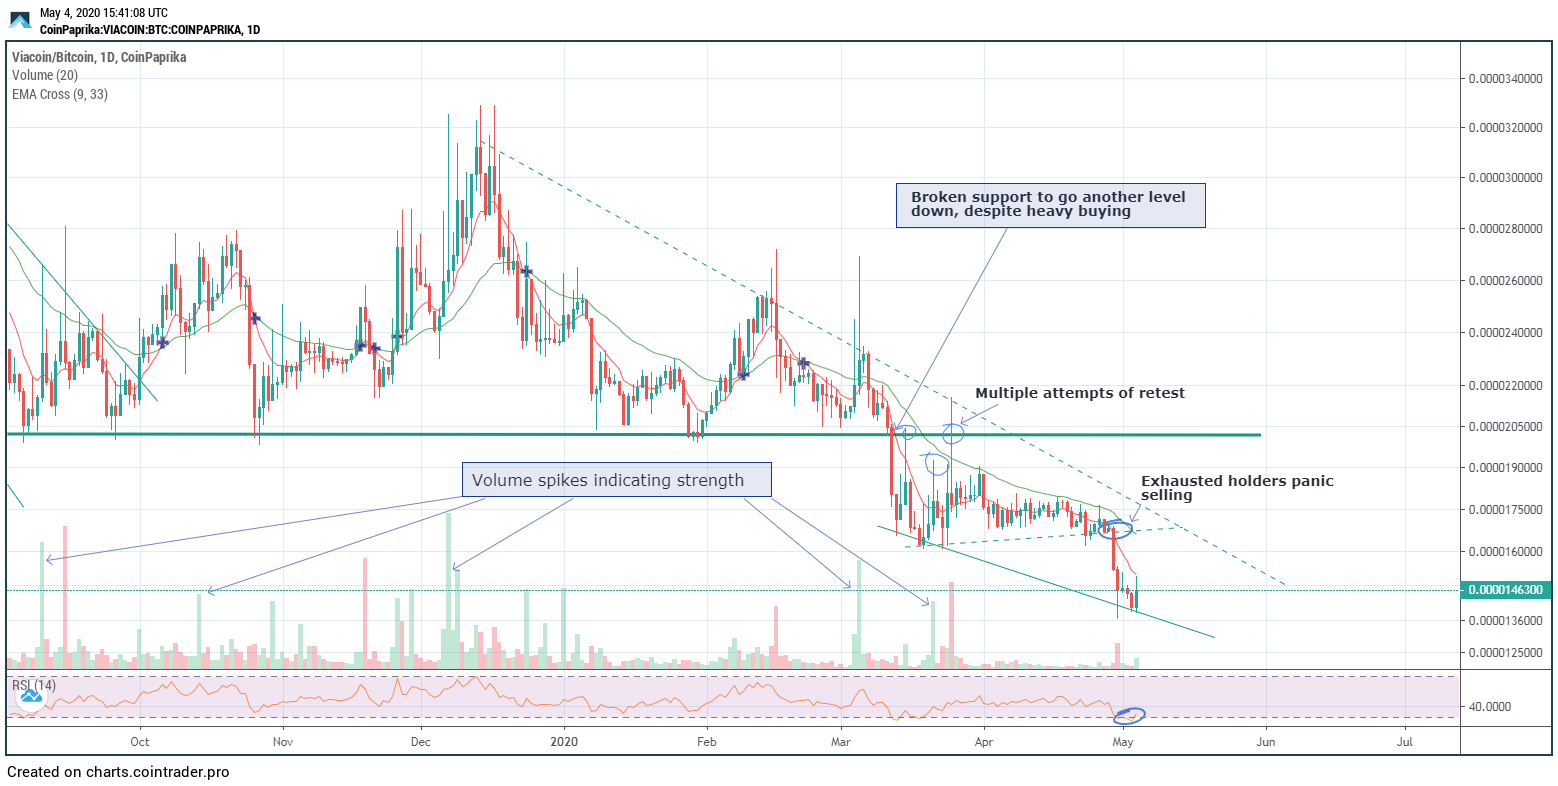
1D candles:
https://charts.cointrader.pro/snapshot/vAGrs
As it can be noticed, VIA had a strong local support on around 0.00002 BTC (green line) which has been tested 7 times prior to finally falling in March.
What can be noticed straight away on the chart is many green volume spikes which indicate buying strength. You can see that during this timeframe of September 2019 to May 2020, there has been more buying than there has been selling, but the price still fell down and the support didn't hold.
This indicates that regular holders are getting tired of waiting, while the accumulation process is still obviously happening.
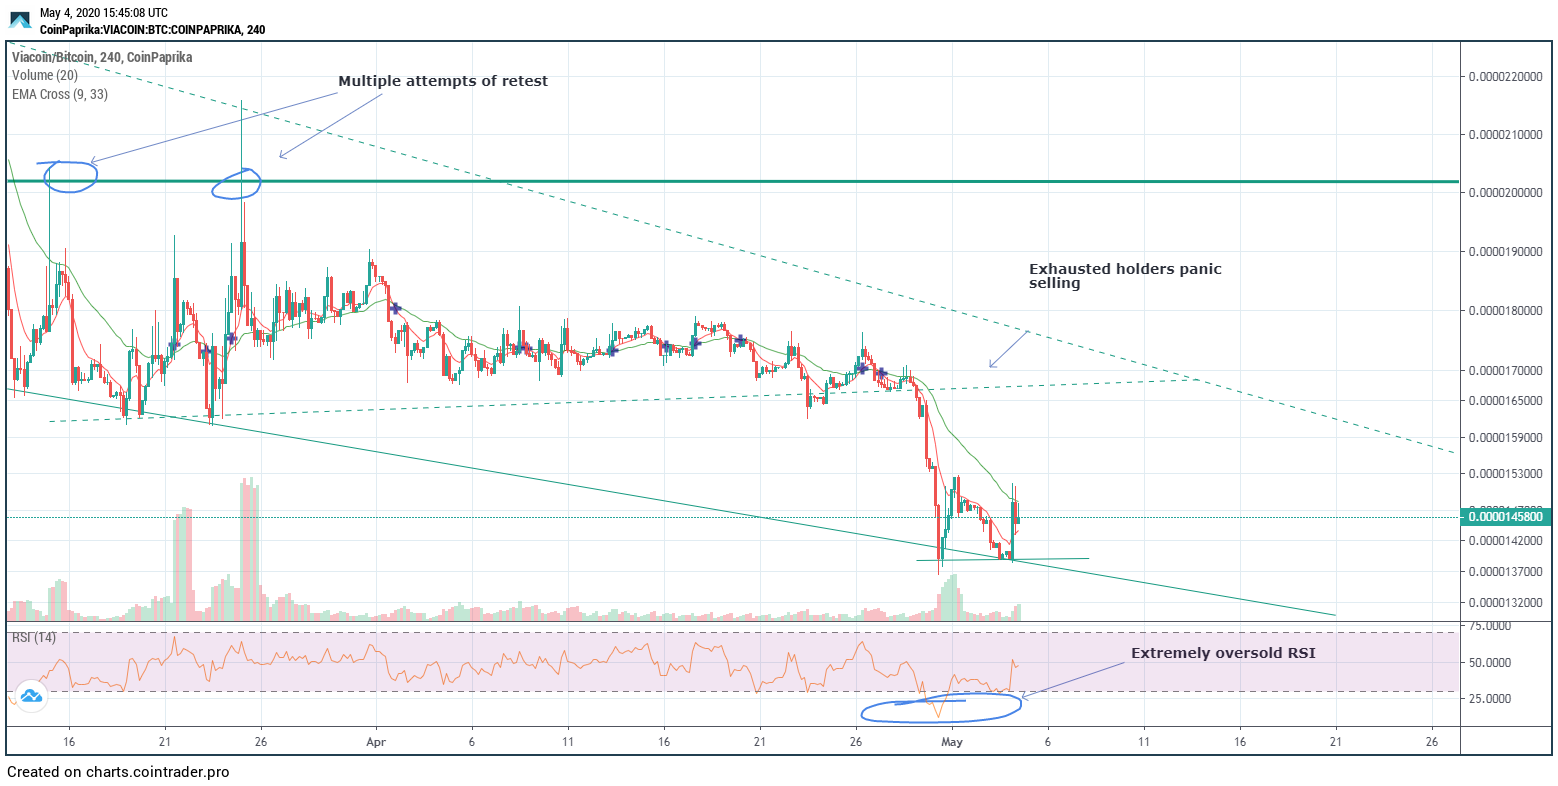
4H candles:
https://charts.cointrader.pro/snapshot/pU47u
Zooming in on 4H candles, we can see the similair story as on daily candles. The only thing that we might notice is that RSI was extremely oversold once the dip on May 1st appeared. Now in the short term, VIA is actually showing some more buying at these prices.
In summary, 1W and 4hr RSI is extremely oversold, eventhough VIA has been getting more regular volume spikes in the past 6 months.
Targets which I see in late 2020/ early 2021 are :
- Target 1: 0.00002 BTC (Attempt to get back at previous level)
- Target 2: 0.00005 BTC (Local high and start of new bull run)
- *Target 3: 0.00008 BTC
- *Target 4: 0.00015 BTC
- *Target 5: 0.00047 BTC
*optional targets
I'll update my thoughts on VIA as time goes by, but this is my long term plan.
Anyways, that's it from me today. Share your thoughts and tell me if you agree with this idea.
Kind regards,
~crixus
good charting here!
Congratulations @crixuscrypto! You have completed the following achievement on the Hive blockchain and have been rewarded with new badge(s) :
You can view your badges on your board and compare to others on the Ranking
If you no longer want to receive notifications, reply to this comment with the word
STOPDo not miss the last post from @hivebuzz:
Vote for us as a witness to get one more badge and upvotes from us with more power!