Hello friends of $BEER, Friends of $HIVE and all others,
here are the:
BEER Statistics for the last week:
The timeframe is from 2022/10/07 - 2022/10/14.
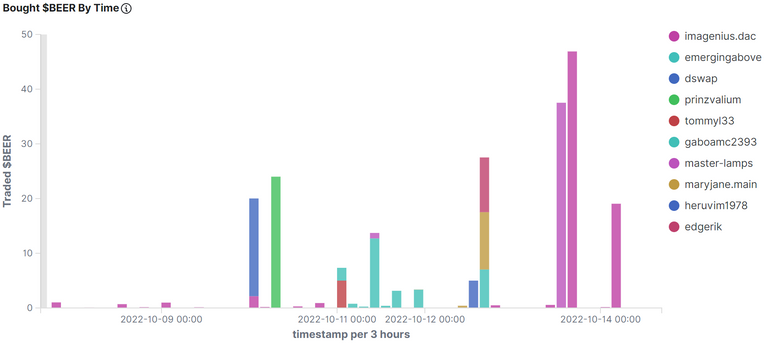
Bought $BEER By Time
This figure shows who has bought how many $BEER at which time:
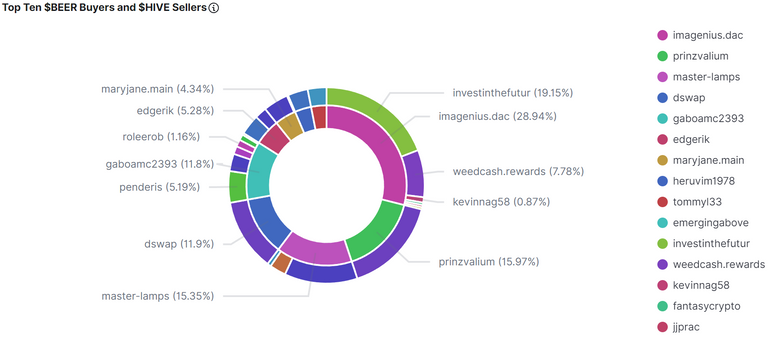
Top $BEER Buyers and $HIVE Sellers
The inside of the circle shows the buyers of $BEER, ordered by $HIVE they have spent. The outside shows the recipients of that $HIVE (sellers of $BEER):
Commulated Amount Of Bought $BEER Per Person
This figure shows the top 10 $BEER buyers, how much they got and how much $HIVE they spend for this. It is sorted by $HIVE, that was spent:
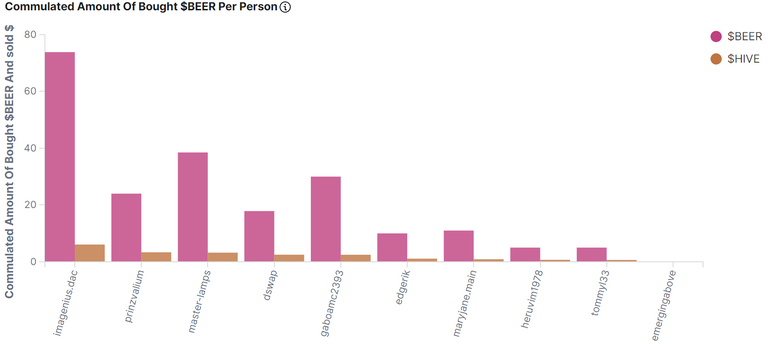
Table Of Top 20 $BEER Buyers
This table shows the top ten buyers of $BEER sorted by the $HIVE, they have spent:
| buyer.keyword: Descending | Sold $HIVE | Bought $BEER | Avg. Price |
|---|---|---|---|
| @imagenius.dac | 6.079774353521657 | 73.83608495670524 | 0.0817437544465065 |
| @prinzvalium | 3.3554396629333496 | 24 | 0.1398099958896637 |
| @master-lamps | 3.224303960800171 | 38.50431966781616 | 0.0983368456363678 |
| @dswap | 2.5 | 17.86863136291504 | 0.13990998268127441 |
| @gaboamc2393 | 2.4779999474121723 | 29.999999874969944 | 0.08259999752044678 |
| @edgerik | 1.10992631316185 | 10 | 0.11099263280630112 |
| @maryjane.main | 0.9107999757761718 | 11.000000115134753 | 0.0828000009059906 |
| @heruvim1978 | 0.6973999738693237 | 5 | 0.13947999477386475 |
| @tommyl33 | 0.6499999761581421 | 5 | 0.12999999523162842 |
| @emergingabove | 0.0002839599910657853 | 0.0019150200532749295 | 0.14827999472618103 |
Commulated Amount Of Sold $BEER Per Person
This figure shows the top 10 $BEER Sellers, how much they sold and how much $HIVE they got for this, sorted by $HIVE:
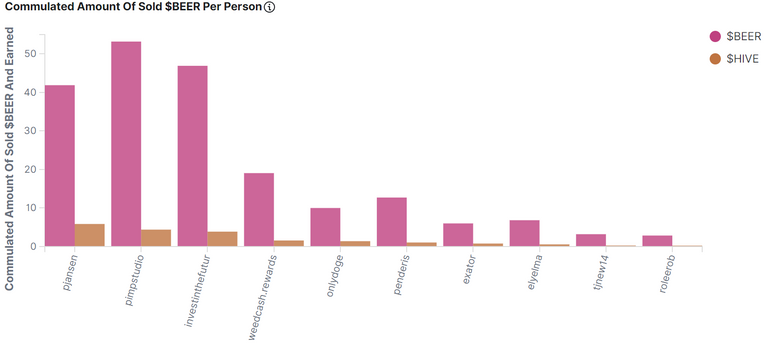
Table Of Top 20 $BEER Sellers
This table shows the top ten sellers of $BEER Sorted by the $HIVE, they have got:
| seller.keyword: Descending | Earned $HIVE | Sold $BEER | Avg. Price |
|---|---|---|---|
| @pjansen | 5.85543966293335 | 41.86863136291504 | 0.13985998928546906 |
| @pimpstudio | 4.392045706510544 | 53.18800067901611 | 0.08260263502597809 |
| @investinthefutur | 3.864264726638794 | 46.89641571044922 | 0.08240000158548355 |
| @weedcash.rewards | 1.5701475143432617 | 19.05518913269043 | 0.08240000158548355 |
| @onlydoge | 1.3950839077297132 | 10.001915020053275 | 0.1424133280913035 |
| @penderis | 1.0503032207489014 | 12.715536117553711 | 0.08259999752044678 |
| @exator | 0.7799999713897705 | 6 | 0.12999999523162842 |
| @elyelma | 0.5638991594314575 | 6.834704875946045 | 0.08250527083873749 |
| @tjnew14 | 0.2648393213748932 | 3.206287145614624 | 0.08259999752044678 |
| @roleerob | 0.2357439547777176 | 2.8540430068969727 | 0.08259999752044678 |
| @steem-hodler | 0.19328400492668152 | 2.3399999141693115 | 0.08259999752044678 |
| @kevinnag58 | 0.17625360190868378 | 2.1389999389648438 | 0.08240000158548355 |
| @fantasycrypto | 0.0824580118060112 | 1.0180000066757202 | 0.08100000768899918 |
| @jjprac | 0.07415241748094559 | 0.8999080061912537 | 0.08240000158548355 |
| @forexbrokr | 0.07290001213550568 | 0.8999999761581421 | 0.08100000768899918 |
| @libert | 0.06360200047492981 | 0.7699999809265137 | 0.08259999752044678 |
| @poliwalt10 | 0.05803200043737888 | 0.7060000151395798 | 0.08215000107884407 |
| @oscarps | 0.04634999856352806 | 0.5625 | 0.08240000158548355 |
| @elevator09 | 0.040458399802446365 | 0.4909999966621399 | 0.08240000158548355 |
| @ga-sm | 0.03220919892191887 | 0.3889999985694885 | 0.0828000009059906 |
| @other | 0.19446133128747078 | 2.374820113001988 | 0.0819625030271709 |
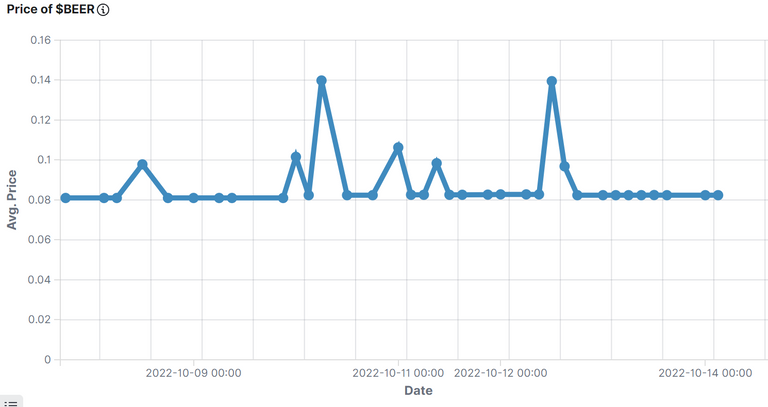
Price of the $BEER
This figure shows the price of $BEER for the last period:
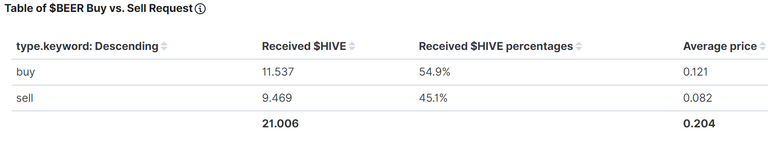
$BEER Summarize Metrics
This table shows how much $HIVE was given by buy-requests, that where equal or higher than the sell order vs. sell-requests, that were equal or lower than the buy order.
If the buy-requests where higher than the sell-requests, then money comes into the system and the value of the token increases.
Under the total line one can see the sum of $HIVE and sum of $BEER that changed the ownership and the average price of $BEER for the last period.
The average price of the token in the picture is wrong, actually it was: 0.088 $HIVE/$BEER
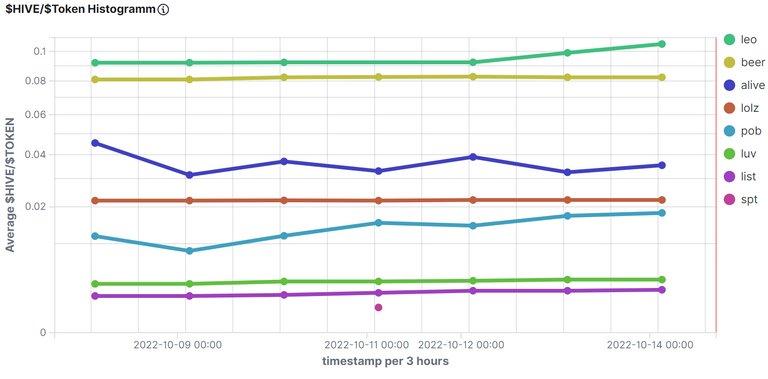
Comparison With Other Tokens
$HIVE/Token
This figure shows the value of $HIVE compared to some token for the last period. Be aware of the nonlinear (root square) y-axes.
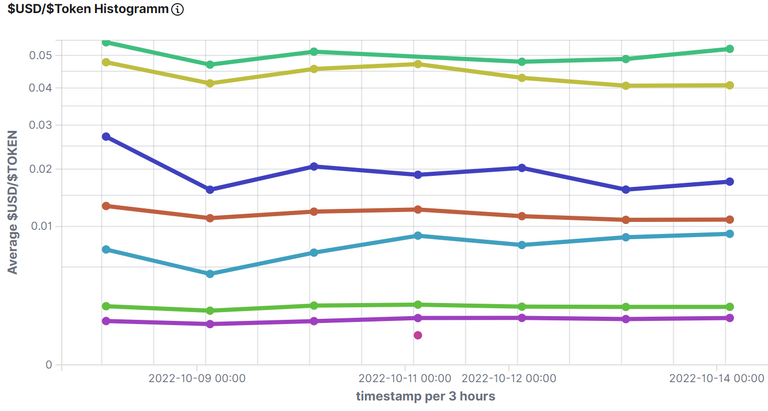
US-Dollar/Token
This figure shows the value of $USD compared to some token for the last period. Be aware of the nonlinear (root square) y-axes.
Rank: 123
origin
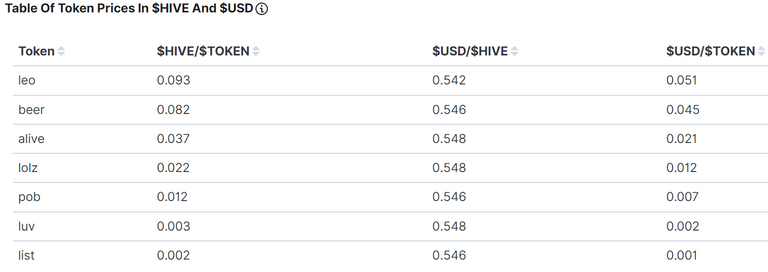
Table Of Token Prices in $HIVE and $USD
This table shows the average value of the prices of the token for the last period. One can see Hive and the US-Dollar compared to the token.
Disclaimer
All stats are without warranty.
They are taken from:
curl -XPOST -H "Content-type: application/json" -d '{ "jsonrpc": "2.0", "method": "find", "params": { "contract": "market", "table": "tradesHistory", "query": { "symbol": "BEER"}, "limit":1000, "offset": 0 }, "id": 1 }' 'https://api.hive-engine.com/rpc/contracts'
I have put them into logfiles and uploaded them to Kibana, from which I took the screenshots.
If you find errors, please tell me!
If you want me to continue the stats, give me some good upvotes ;-)
If you want to see other statistics (even from totaly other data), please contact me. I can create them weekly or monthly if I get some rewards for it.
For more details see here: How I Have Set Up Elasticsearch And Kibana On My Raspberry Pi To Monitor Token Activities and here: Do You Want To See Statistics Of Your Favorite HIVE Token? or on github.
Here are the stats from the other tokens I observe: https://peakd.com/@achimmertens/posts?filter=stats
Regards, Achim Mertens
