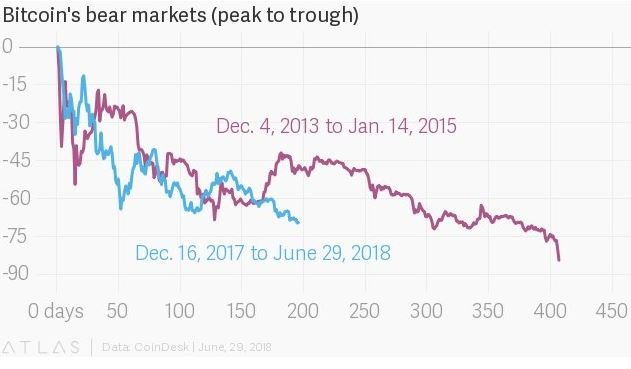
쿼츠(Quartz)는 2014년과 2018년 비트코인의 중간 가격 동향을 비교한 차트를 공개했으며, 2017년 12월부터 올해 6월까지의 비트코인을 움직임을 바탕으로 분석됐다.
2014년과 2018년은 매우 비슷하다.
2013년 12월 4일부터 2015년 1월 4일까지 400일만에 비트코인 가격이 80%이상 떨어져 사상 최악의 가격조정을 기록했다. 비트코인 가격의 중간 하락세는 4개월동안 지속돼 비트코인은 당초 지원 수준만 회복한 뒤, 횡보하다 결국 80%이상 다시 하락할 수 밖에 없었다.
2014년엔 비트코인이 300일만에 70%이상 하락했다. 2018년엔 비트코인이 72%이상 감소하는데 200일도 채 걸리지 않았으며, 비트코인은 4년전보다 현저하게 빨리 하락하고 있다.
2013년 12월부터 2015년 1월까지 비트코인의 가격차트와 2013년~2015년까지 비트코인 차트를 압축해서 비교하자면, 비트코인의 가격추세는 2014년의 가격추세와 거의 동일한 움직임을 보이고 있으며, 하나의 주요 차이점은 속도이다.
순수하게 현재의 비트코인의 가격 동향과 2014년의 비트코인 가격 동향에 근거하여, 비트코인은 2014년 수정 버전의 속도가 빨라지고 있다. 비슷한 시기에 유사한 감소와 시정 조치를 겪었으며, 안정된 지역에서 더 아래로 내려가는 추세에 놓여있다.
2014년 비트코인 연도차트와 비트코인 압축차트를 비교하면 유사점을 발견할 수 있다.
짧은 가격조정
아서 헤이즈는 6월 30일 CNBC 패스트 트레이더와의 인터뷰에서 비트코인의 저점은 3,000달러에서 5,000달러까지 80%이상의 가격 조정이 이루어질 수 있다고 밝혔다.
물론, (2018년까진 5만달러에 이를 수 있다.) 6,000달러 이하로 아니면 3,000달러에서 5,000달러까지 바닥칠 수 있다고 생각하지만, 아마 SEC가 ETF를 승인하여 비트코인은 2만달러에서 5만달러까지 오를 것이라는 긍정적인 결론을 내렸다.
비트코인이 2014년때의 가격 조정을 빨리 진행한 것을 감안하면, 업계의 시장 여건과 규제 상태 차이를 감안 할때 현재의 조정은 상당히 빠르게 종료될 가능성이 높아보인다.
또한, 헤이즈가 언급했듯이 미국 정부나 다른 선도적인 암호화폐 시장에 대한 예기치 못한 규제 변화는 비트코인 및 기타 주요 디지털 자산의 가격이 강력한 모멘텀과 수요로 회복될 것으로 보인다. 특히 ETF나 공식적으로 거래 가능한 상품이 미국 금융시장에 출시된 경우엔 더욱 확실하다.
Quartz released a chart comparing mid-price trends for Bitcoin between 2014 and 2018, and analyzed the move based on the beat coin movement from December 2017 to June of this year.
2014 and 2018 are very similar.
Between December 4, 2013 and January 4, 2015, bit coin prices have fallen by more than 80% in 400 days, recording the worst price adjustment ever. The decline in bit coin prices lasted for four months, and bitcoin had been recovering from its original support level, and was forced to decline again after more than 80%.
In 2014, the beat coin dropped more than 70% in 300 days. In 2018, the bit coin dropped more than 72% in less than 200 days, and the beat coin is declining significantly faster than it was four years ago.
Compared to December 2013 through January 2015, Bitcoin's pricing trends and bitcoin charts from 2013 to 2015 are compressed. Bit-coin pricing trends are almost the same as in 2014, One major difference is speed.
Based on purely current bitcoin price trends and 2014 bit coin price trends, bitcoin is accelerating the revised version in 2014. Similar declines and corrective actions have taken place at similar times, and the trend is to go further down in stable areas.
Similarities can be found by comparing 2014 bitcoin year charts and bitcoin compression charts.
! [2014 .JPG] ()
Short price adjustment
Arthur Hayes said in an interview with CNBC Fast Trader on June 30th that the bottom of the beat coin could be priced over 80% from $ 3,000 to $ 5,000.
Of course, I think it could be down to $ 6,000 or $ 3,000 to $ 5,000 by 2018, but the SEC has approved the ETF, and the beat coin is $ 20,000 to $ 50,000 It was a positive conclusion that it would rise.
Given that Bitcoin has made price adjustments fast in 2014, the current adjustment is likely to end fairly quickly, given market conditions and regulatory differences in the industry.
Also, as Hayes noted, unexpected regulatory changes to the US government and other leading cryptographic markets are likely to return to strong momentum and demand for bitcoin and other key digital assets. Especially when ETFs or officially tradable goods are introduced into the US financial markets.