
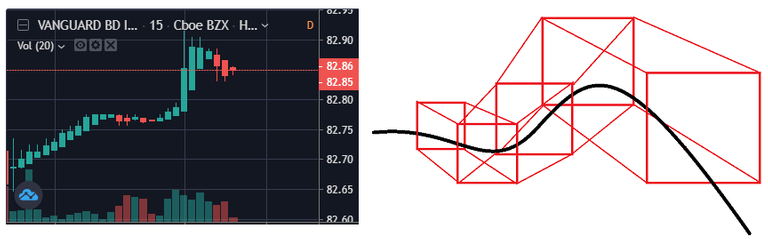
When looking at a typical stock chart (below left) understand what you are looking at- a two dimensional "image" moving forward in time.
If you look at the image on the right, this is how price action actually works. Price action moves moves thru space and time in 3 dimensions- more or less around one standard deviation. Sure, price action can way exceed one standard deviation however, a return to the mean then becomes more likely.
Sideways price movement, that is flat price action thru time then becomes a question of volume. If the price action of a stock is flat on low volume think of the price action, even though flat, as moving away from you. Conversely, if the price action is flat on high volume think of the price action as moving towards you.
If you can envision the price action as moving forward in three dimensions, you can make better, more intelligent trading decisions.
Gregory Mannarino
Visit my website. Click here: https://www.traderschoice.net/
Thanks again, In the chart I see wealth moving from many pockets to one pocket.
Greg, it sounds really interesting. Are you saying we should pay attention especially when the price action is moving towards us?
All directions are important.
Thanks pilgrim.