We have all experienced, at least once, that feeling of fear, or excitement, that comes over us when we place a buy or sell order. But before we press that button to place the buy or sell order, the following questions always seem to pop up: Is this a good time? Am I doing the right thing? Is it reasonable? What if cryptocurrency goes the other way tomorrow? Getting accurate market highs and lows are almost impossible in volatile cryptocurrency markets. However, in this post, we are going to explore a metric that may help us identify bullish and bearish movements in the market.
Mayer Multiple Indicator
To fully understand this indicator, let's start by defining it. Created by the investor, Trace Mayer, Mayer's multiple is defined as "The multiple of the current price of Bitcoin (BTC) on the 200-day moving average (MA)." i.e. Mayer Multiple = price / 200 day MA.
In technical analysis, it is generally considered bullish (or positive) when prices are above the long-term MA. At the same time, it is deemed to be bearish (or negative) when the price is below the MA.
The consequences aren't so straightforward though. For example, if the price is significantly above the long-term MA, it often means that the underlying asset has been overvalued, or what is commonly referred to as "overbought." The reverse occurs when the price falls too far below the MA.
Multiple Mayer quantifies the difference between the price and the moving 200 day MA to define the historical prices at which BTC enters a speculative bubble. In other words: when their price exceeds its intrinsic value significantly.
What is today's Mayer Multiple?
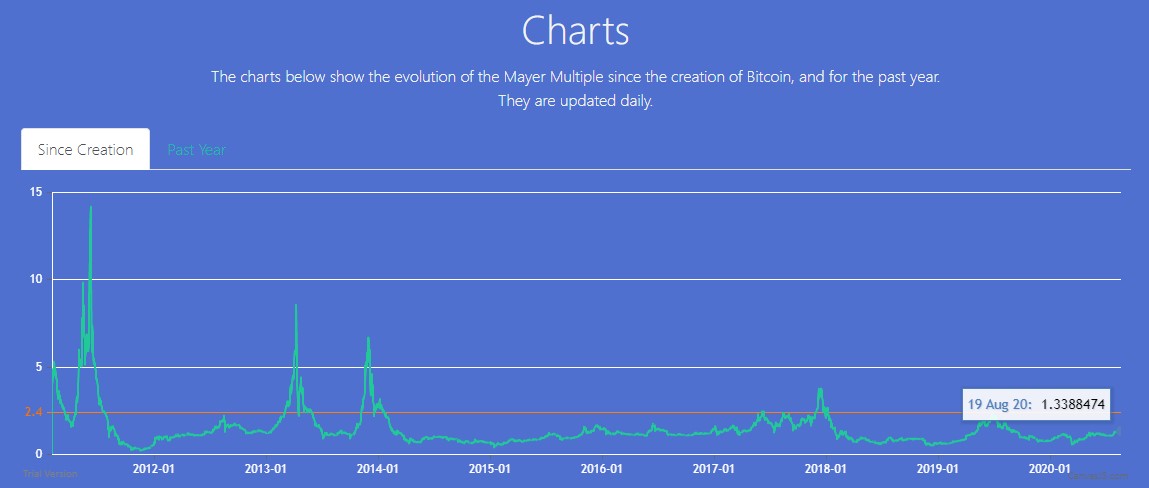
At the time of writing this article, the current Mayer Multiple is 1.33. It is using the BTC price of $11775.33 and a 200 day MA of $8853.63. Therefore, the Mayer Multiple is 1.33 times today's 200 day MA. Ok, so what does that mean?
Unpacking the Mayer Multiple
The two specific values which must be taken into account when using Multiple Mayer are 1 and 2.4. The meaning of a multiple of 1 is simple: any amount greater than 1 means that BTC's price has reached the 200 day MA and any value less than 1 means the price has fallen below it.
By comparing multiples below 1 to the corresponding price action, it is clear that significant bear markets occur when prices are accepted below 200 MA. On the other hand, the BTC market favours the bulls when the Mayer Multiple is greater than 1, with one exception.
Any multiple above the 2.4 threshold has always shown the start of a speculative bubble which is significant because all bubbles eventually burst, leading to rapid depreciation. By performing historical data-based simulations, Mayer deduced that the best long-term results were obtained by accumulating BTCs when Mayer's multiple was below 2.4.
In a nutshell, a very high Mayer Multiple represents extreme overbought or bubble conditions. As a result, BTC could see a corrective withdrawal or outright sale, in which case prices could eventually fall below the 200 day MA, causing the Mayer Multiple to fall below 1. However, this could prove to be a bear trap, since short-term overbought conditions usually accompany a sharp drop in extreme overbought conditions to levels below 200 days. An unusually low number could be considered a leading indicator of BTC approaching a significant bottom.
This is all great, but you are still probably wondering when do you sell and buy??? Let's explore further by analyzing Ethereum (Eth).
Eth Mayer Multiple
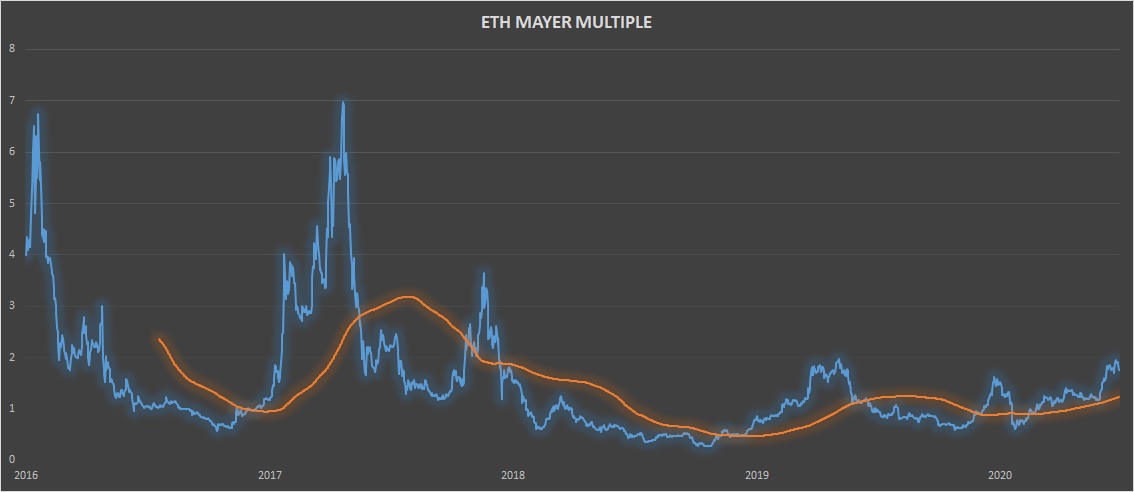
Looking at the above chart, you will notice that the Mayer Multiple for Eth often remains in and around 1-1.5 Mayer Multiple. This means historically; Eth has remained in or above its 200 day MA. The maximum recorded value is 6.97. Likewise, the lowest recorded value is 0.27. These extremes can represent extreme tops and bottoms of the market cycles.
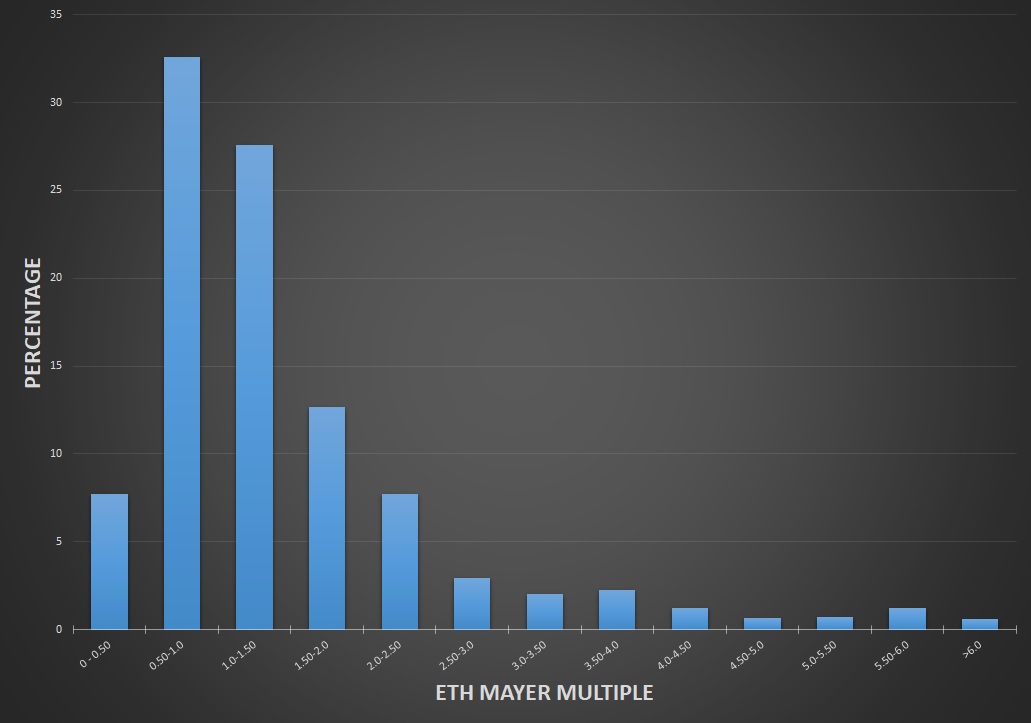
The above chart is the histogram of the Eth Mayer Multiple. Each bin (column) represented the percentage when the Mayer Multiple was in a particular range. Looking at the data, 67.8% of Eth's Mayer Multiple ranges between the 0.5 and 1.5 range.
Today's Mayer Multiple is 1.76, which tells us that its Eth's spot price is above its 200 day MA by a factor of 1.76 (remember Mayer Multiple = spot price / 200 day MA). Which makes sense as Eth has been on a nice run the past 2 months. Another useful chart would be to plot the cumulative percentages for the bins above.
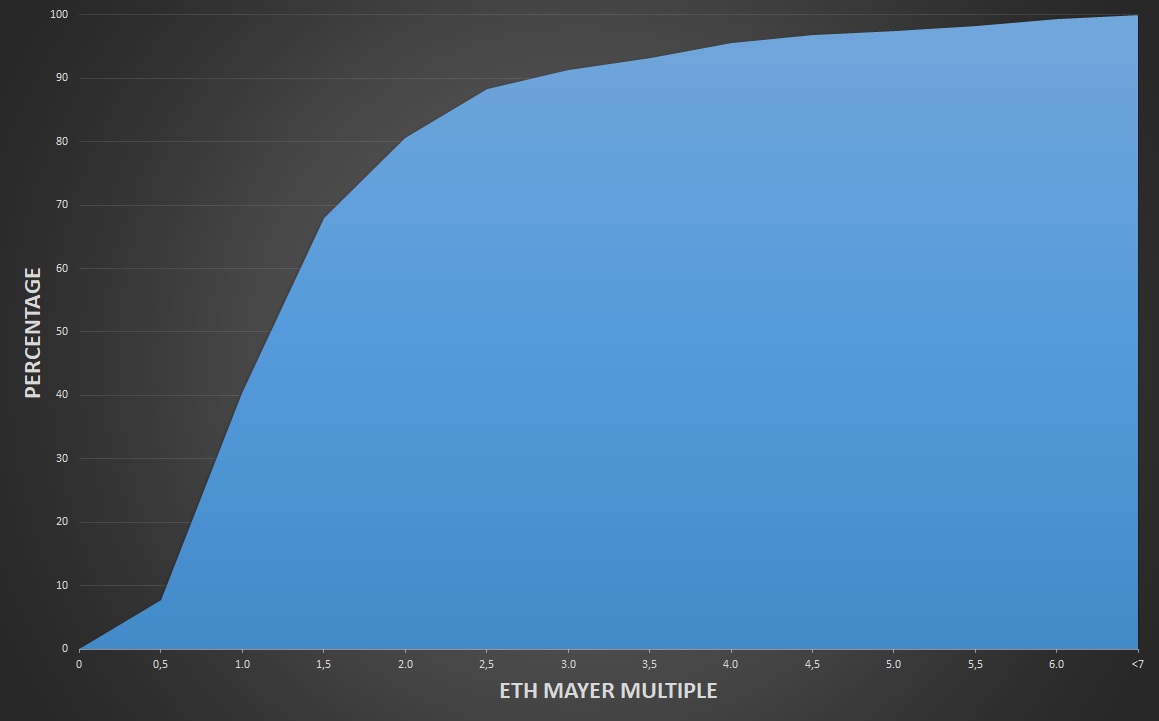
It shows us that 100% of the Mayer Multiple values were less than 7. Today's value of 1.76 Mayer Multiple, means that the Mayer Multiple has been less than or equal to 1.76 approximately 75 % of the time. These percentages can be viewed as probabilities which are to say that we estimate there is a 25% probability that Eth's price would increase or 75% probability that Eth's price would decrease.
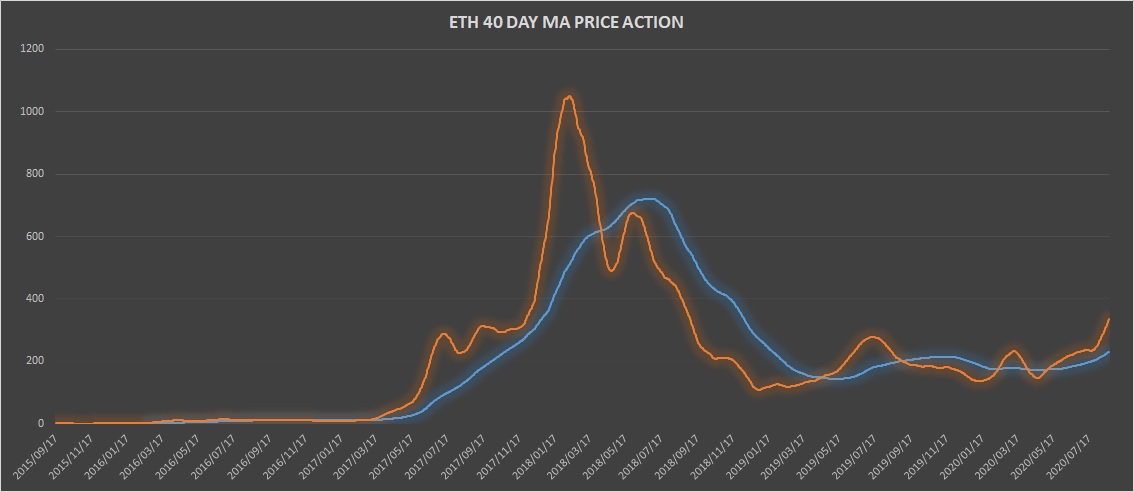
We would need to combine this analysis as a rising Mayer Multiple could mean there is increasing price action and the price becoming bullish concerning its 200 day MA. The 40 day MA can be used to visualize this trading activity over the past 40 weeks.
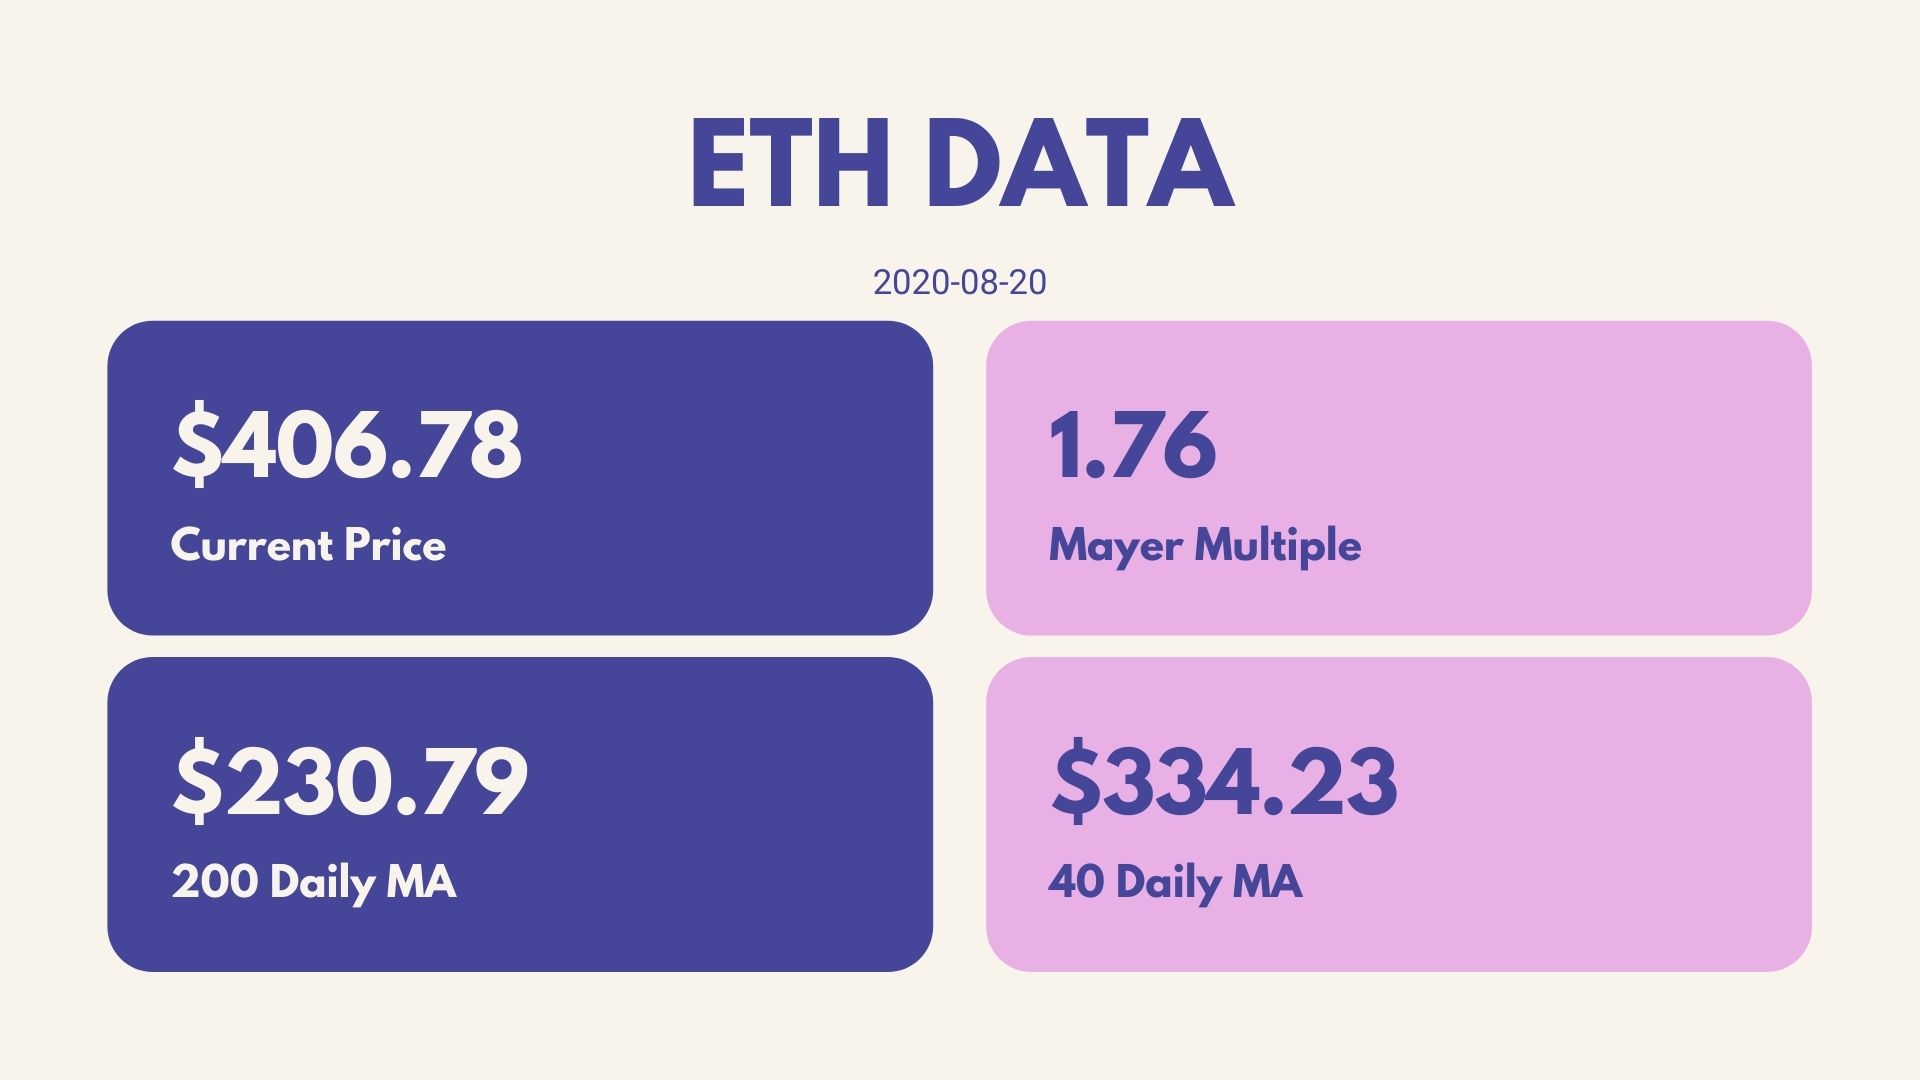
Summarizing all of this data for Eth reveals the data table below.
In the practical case above, we spoke of indicator, not a signal. The Mayer multiple is not an indicator for accurately predicting the highest or lowest prices. Also, it's not about maximizing or minimizing the Mayer Multiple, which could mean you are buying at the top or bottom. The main interest of this indicator lies in its ability to visualize trend changes by using a simple framework.
If you enjoyed this article and would like to me do the same statistical analysis for another coin, please comment below, and I will look to include it in a future post. I plan to do a weekly post analyzing the overall crypto markets using the Mayer Multiple as the basis for the analysis.
Thank you for reading and hope you have a good rest of the day!
Resources
I also post my content on the following platforms:
Publish0x: https://www.publish0x.com/@aftershock9?a=Vyb82ANmev
Hive: https://hive.blog/@mercurial9
Read.cash: https://read.cash/@merurial9
Uptrennd: https://www.uptrennd.com/user/mercurial9
Steempeak: https://steempeak.com/@mercurial9
Instagram: https://www.instagram.com/minimalistpixel/?hl=en
Pinterest: https://za.pinterest.com/minimalistpixel/boards/
Congratulations @mercurial9! You have completed the following achievement on the Hive blockchain and have been rewarded with new badge(s) :
You can view your badges on your board And compare to others on the Ranking
If you no longer want to receive notifications, reply to this comment with the word
STOPDo not miss the last post from @hivebuzz: