The global economy seems to be on a never-ending growth binge. It appears that it will never stop and the excitement from everyone is quite evident. Get in now, so you don't lose out on potential future gains or FOMO as people call it. There is still a lot of resentment against the banksters from what they did to the world's population in 2008, but it seems as the central banks can extend this growth the populace forgets it. Will most people be loured in again at the top?
NOTE:
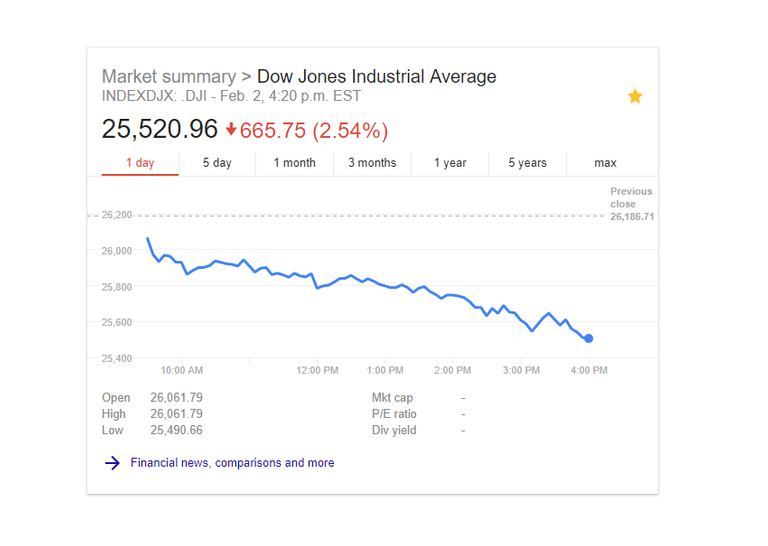
As I was writing This, we had a record daily drop of 665 points in DOWJ never seen since the financial crisis of 2008.
History of bubbles and human psychology around making money tells us that when the euphoria kick in even the more square-headed people who might have been very fundamental in their views might throw out all of their knowledge about this and look at markets as it has created a positive feedback loop to be in a neverending growth. It seems like this will never end. It feels so good inside, and the centre of the brain who gets triggered by cocaine users gets triggered by making money and lots of it.
You might end up losing it all as greed kicks in, and you think the markets will go to new historical highs, but then the inevitable happen, and markets come crashing down.
I want to share with you my analysis of the different markets around the world from Stocks, Bonds, Crypto, Real Estate and Gold and Silver. I will give you my personal opinion on what I think is at high risk and why and also how one can mitigate them if you are exposed and how to transfer that risk over to something less risky possibly. The Bond, Crypto, Real Estate and Precious Metals will be touched upon in a later article.
Let's start with Stock Markets around the world:
The US
I will only touch upon a few of the most critical exchanges as it would be a mini book in itself. We will look at the biggest and most overvalued and undervalued ones. Over the last ten years since the recent economic crash happened, we have seen a meteoric rise in stocks. Not meteoric vs. the old tops as the return is not that good. The people who bought shares at the bottom and were riding it up have of course made a lot of money, but the general populace hasn't seen much to this. Especially most of them who are in it for the long term to "secure" their retirement.
Let's look at the numbers since 2007 when Dow Jones hit the peak of 16424.63 points. How much return has that created for the average investor as we now are at 26149.39 points? That is an increase of 59.21%. The annual yield is 5.921% that sounds great, but if you are an average Canadian investor as an example, your investment loses about 2% in Management Expense Ratio fees. Now we are at 3.921%. That doesn't look that good. What made it look better was your constant money flow into your retirement fund. Also taking away the average inflation in Canada over the last ten years 1.39% "official numbers looking at prices my self I would say we are closer to 3%+ Let's use the low government estimate. Now you are at 2.531% return. Then you got to remember 30-40% will be taken in taxes of that money. So if you invested over the last 11 years as this example shows you can remove another 2.72% of taxation and you are suddenly in the negative -0.21%.
Just another experiment to show you how you lose out. Let's take the Dow Jones from the last crash and that peak back in 1999 December 16843.28 that is a return of 55.25% over almost 20 years. Lets quickly rerun the numbers to show you how you lose money not win against inflation using the Longterm investment strategy in stocks. Now you have an average return of 2.63%. Let's remove the 2% average Canadian MER fee. 0.63% is your new return. Now we have to take away the average yearly inflation 1.91% now you have -1.28% in return. Then we take away your tax burden over those years, and you have -2.27% return. But don't worry as long as you keep throwing money at it on a monthly basis you don't have to worry about your money losing its value in your portfolio. Magically it looks like you have gained.
Don't worry diversify! Well then if you bought the SP500 you would have had a return of 35.11% over the last 21 years. That is an average return of 1.67% not even beating inflation.
If you were smart and invested at the bottom of the market in just an ETF, you would have gained a lot of more money, but that's not what you are being taught. If you invested at the 2009 low, instead of staying in the markets, you would have made 214.92%. That is an average of 23.88% return, and you did it on the outside of an RRSP, or a 401k system as described above you can remove the fees but still have to pay 25% taxes on capital gain. -1.97% average inflation and you are at 21.91% return and minus capital gains tax. You will end up with a return of 16.44% return.
The clue here is to not be a sheep on its way to the slaughterhouse. You need to take advantage of understanding what the powers at be the banksters won't tell you. Buy low and sell high. The emotional investor buys high and sells low.
Now back to analyzing the stock markets!
Let's analyze the 500 biggest companies in the US and their P/E ratio. And what it'll tell us about the current market conditions that we are in:
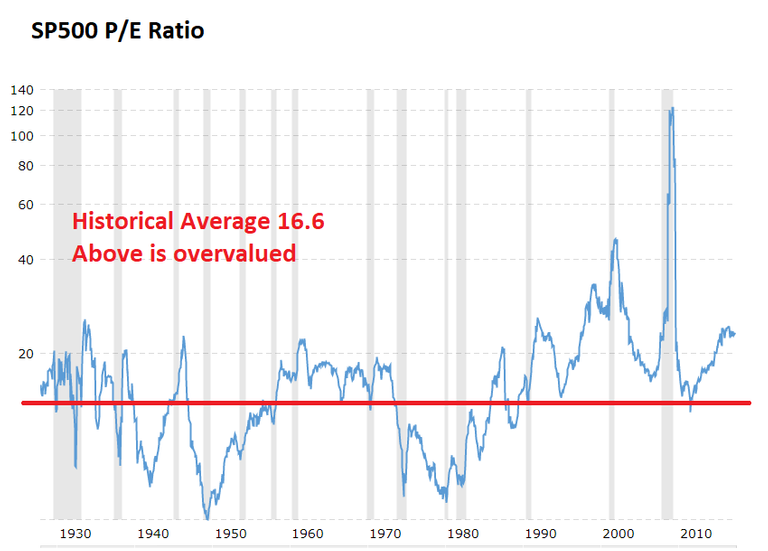
As you can see throughout the times, the P\E ratio has been quite low when there were market crashes. The average is 16.6. And markets have crashed at different over valuations. What is showing is that we are in an overvaluation of the stock market? Currently, the US SP500 P/E is at 23.19 That is higher than the crashes in 1929,36, 45, 49, 54, 57, 60, 69, 74, 80, 82 and 1990. This should tell us that even if the P/E is not as high as 2001 which it is close to or 2008 which was sky high, there should still be substantial worries about the US stock markets as most market crashes before had way lower P/E ratios before they crashed.
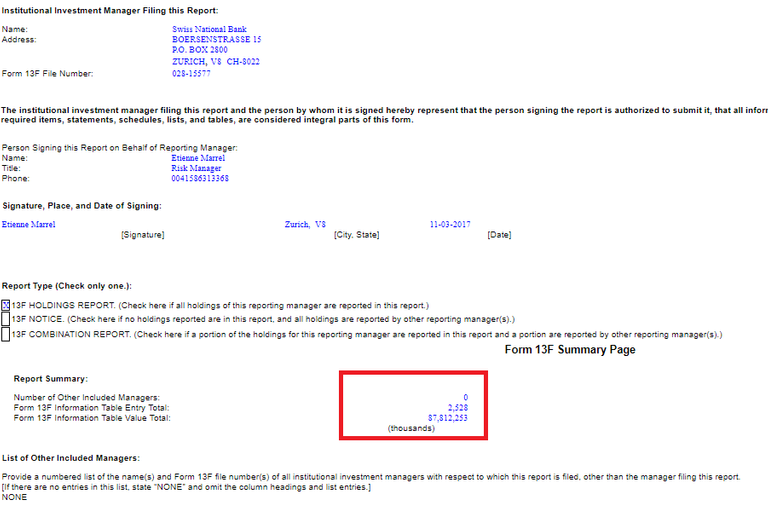
You also have to remember that even central banks have been propping up the US markets with the SNB Swiss National Bank buying US stocks outright. The US stock market has also been artificially kept up with debt. From Margin Debt to Corporate Debt used to buy back own shares manipulating the real price of their company stock.
As an example, the Swiss National Bank owns $87,8B in US stocks. If you don't believe me, look at their US Securities filing a link to it below. https://www.sec.gov/Archives/edgar/data/1582202/000158220217000004/xslForm13F_X01/primary_doc.xml
Norges Bank which is the Central Bank of Norway owns through its Sovereign Wealth Fund the Oil Fund $243.69B in US stocks. This is way higher than the Swiss National Bank. Also, take a look at the documentation if you won't believe me.
https://www.sec.gov/Archives/edgar/data/1374170/000137417017000020/xslForm13F_X01/primary_doc.xml
Italy's central bank holds around $1.72B in US stocks. If you don't believe me look it up here: https://www.sec.gov/Archives/edgar/data/1426449/000142644917000008/xslForm13F_X01/primary_doc.xml
In 2011 there was a 13F report from Bank of Ireland stating that they hold $3.58B in holdings. I am not sure if these stocks are still owned by Bank of Ireland here is the link. https://www.sec.gov/Archives/edgar/data/1055955/000105595511000002/live13f.txt
I found this one interesting as it lists a wide array of the most significant stocks in the US SP500.
Name of Issuer Class CUSIP Value Shares SH /PRN Put / CaDiscret MgrsSole
Elan PLC ADR 284131208 25,483 4,447,355 4,447,355
Icon PUB LTD CO SPONSORED ADR 45103T107 15,329 699,940 699,940
PPG INDS INC COM 693506107 68,697 817,141 817,141
Procter & Gamble CO COM 742718109 38,980 605,933 605,933
Exxon Mobil CORP COM 30231G102 97,439 1,332,589 1,332,589
Coca Cola CO COM 191216100 1,662 25,274 25,274
Viacom INC NEW CL B 92553P201 29,535 745,654 745,654
Hewlett Packard CO COM 428236103 53,023 1,259,456 1,259,456
Wal Mart Stores INC COM 931142103 88,168 1,634,861 1,634,861
Johnson & Johnson COM 478160104 99,687 1,611,761 1,611,761
Altria Group INC COM 2209S103 2,229 90,543 90,543
McDonalds CORP COM 580135101 907 11,813 11,813
United Technologies CORP COM 913017109 24,971 317,207 317,207
Northrop Grumman CORP COM 666807102 35,767 552,124 552,124
Abbott LABS COM 2824100 19,502 407,058 407,058
ADVANCED MICRO DEVICES INC COM 7903107 25,852 3,160,368 3,160,368
Agco CORP COM 1084102 55,827 1,101,995 1,101,995
Amgen INC COM 31162100 64,472 1,174,350 1,174,350
Fortune Brands INC COM 349631101 31,391 521,019 521,019
Valero Energy Corp NEW COM 91913Y100 13,393 579,299 579,299
Comcast CORP NEW CL A 20030N101 29,922 1,361,942 1,361,942
Apple INC COM 37833100 16,149 50,064 50,064
AVON PRODS INC COM 54303102 47,166 1,623,052 1,623,052
Verizon Communications INC COM 92343V104 30,227 844,804 844,804
Firstenergy CORP COM 337932107 33,881 915,211 915,211
Bristol Myers Squibb CO COM 110122108 1,909 72,091 72,091
JPMorgan Chase & CO COM 46625H100 111,284 2,623,390 2,623,390
Cigna CORP COM 125509109 28,494 777,253 777,253
Cisco SYS INC COM 17275R102 54,282 2,683,261 2,683,261
ENSCO PLC SPONSORED ADR 29358Q109 18,711 350,522 350,522
Citigroup INC COM 172967101 1,506 318,316 318,316
Computer Sciences CORP COM 205363104 20,535 414,009 414,009
Morgan Stanley COM NEW 617446448 40,381 1,484,063 1,484,063
Disney Walt CO COM DISNEY 254687106 802 21,387 21,387
Ecolab INC COM 278865100 38,884 771,192 771,192
Equifax INC COM 294429105 40,925 1,149,572 1,149,572
General Electric CO COM 369604103 44,853 2,452,326 2,452,326
Goldman Sachs Group INC COM 38141G104 949 5,642 5,642
Illinois Tool WKS INC COM 452308109 2,549 47,738 47,738
Intel CORP COM 458140100 52,017 2,473,471 2,473,471
International Business Machs COM 459200101 50,350 343,077 343,077
International Flavors&Fragra COM 459506101 22,794 410,037 410,037
ITT CORP NEW COM 450911102 49,808 955,833 955,833
Hartford FINL SVCS GROUP INC COM 416515104 44,525 1,680,832 1,680,832
Lilly ELI & CO COM 532457108 3,016 86,064 86,064
LOWES COS INC COM 548661107 83,694 3,337,078 3,337,078
Metlife INC COM 59156R108 61,477 1,383,368 1,383,368
Medtronic INC COM 585055106 10,385 280,000 280,000
Microsoft CORP COM 594918104 133,847 4,793,940 4,793,940
Bank of America CORPORATION COM 60505104 65,313 4,896,041 4,896,041
Northern TR CORP COM 665859104 50,999 920,387 920,387
Wells Fargo & CO NEW COM 949746101 68,924 2,224,072 2,224,072
Occidental PETE CORP DEL COM 674599105 52,158 531,681 531,681
Oracle CORP COM 68389X105 78,892 2,520,496 2,520,496
Paychex INC COM 704326107 13,291 430,000 430,000
Penney J C INC COM 708160106 69,200 2,141,763 2,141,763
Pepsico INC COM 713448108 36,238 554,689 554,689
Pfizer INC COM 717081103 61,947 3,537,794 3,537,794
PNC FINL SVCS GROUP INC COM 693475105 58,026 955,639 955,639
Qualcomm INC COM 747525103 2,692 54,392 54,392
Kraft Foods INC CL A 50075N104 46,589 1,478,559 1,478,559
Schlumberger LTD COM 806857108 1,257 15,059 15,059
Zimmer HLDGS INC COM 98956P102 39,014 726,790 726,790
Edison INTL COM 281020107 36,364 942,077 942,077
AT&T INC COM 206R102 51,530 1,753,907 1,753,907
Chevron CORP NEW COM 166764100 80,183 878,716 878,716
Stryker CORP COM 863667101 50,576 941,819 941,819
Toll Brothers INC COM 889478103 43,515 2,290,275 2,290,275
Unitedhealth Group INC COM 91324P102 58,179 1,611,152 1,611,152
Walgreen CO COM 931422109 50,584 1,298,356 1,298,356
WESTERN DIGITAL CORP COM 958102105 20,314 599,222 599,222
Conocophillips COM 20825C104 78,136 1,147,375 1,147,375
BERKSHIRE HATHAWAY INC DEL CL B NEW 84670702 887 11,070 11,070
ACE LTD SHS H0023R105 41,692 669,758 669,758
Google INC CL A 38259P508 1,605 2,702 2,702
Shaw Group Inc COM 820280105 44,276 1,293,494 1,293,494
Accenture PLC IRELAND SHS CLASS A G1151C101 32,589 672,077 672,077
Seagate Technology PLC SHS G7945M107 1,200 79,809 79,809
Philip Morris INTL INC COM 718172109 41,292 705,489 705,489
Merck & Co Inc New COM 58933Y105 37,756 1,047,622 1,047,622
CA INC COM 12673P105 41,678 1,705,310 1,705,310
HANESBRANDS INC COM 410345102 37,428 1,473,558 1,473,558
Tyco International LTD SHS H89128104 63,390 1,529,677 1,529,677
Discover FINL SVCS COM 254709108 54,174 2,923,597 2,923,597
ROYAL BK CDA MONTREAL QUE COM 780087102 825 15,667 15,667
Suncor Energy INC NEW COM 867224107 52,065 1,351,476 1,351,476
VALE S A ADR REPSTG PFD 91912E204 18,243 603,677 603,677
Taiwan Semiconductor MFG LTD SPONSORED ADR 874039100 99,777 7,956,677 7,956,677
KT CORP SPONSORED ADR 48268K101 14,179 681,678 681,678
Teva Pharmaceutical INDS LTD ADR 881624209 20,281 389,046 389,046
The above information is interesting as it tells us that central banks are intervening in the stock markets in the US. What we don't know is if they are doing this in their own or other countries. Its just speculation, but one can only make its conclusions from the information.
Remember also the constant low-interest rate from central banks is a secondary measure to manipulate asset prices in the stock market indirectly.
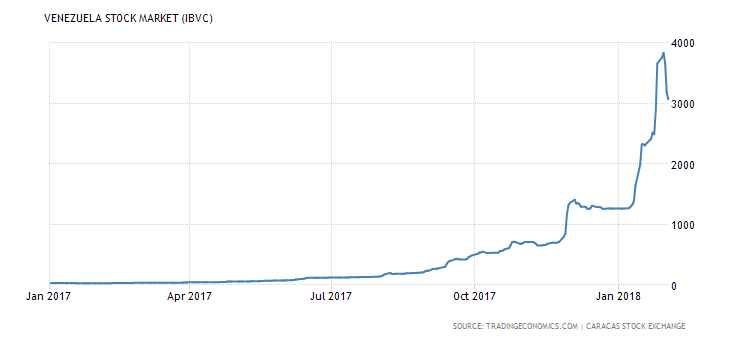
Now that I talked about the interference by central banks into stock markets it is time to look at some of the markets in other countries. I have one more thought. When it comes to the ever-increasing value of stock markets, this is also a sign of inflation as there is more money flowing into these markets as the currencies lose their value from overprinting of cash and debt by central bankster scams. A great example of this is the Venezuelan Stock Exchange. As you could see that the hyperinflation made the stock market that was collapsing grow even though the economy was going to waste.
Insane. Is that why Stock exchanges keep on going up in value. What if the fuel burns up or the economy is struggling with deflationary pressures from demographics and retirement withdrawal from markets? That brings me to the next market the NIKKEI Index in Japan. Formerly one of the best economies in the world, but as growth failed their stock exchanges were trading sideways as there is no monetary fuel left to burn from the Bank of Japan. Don't worry they have been busy and have indirectly bought stocks through ETF's Exchange Traded Funds they are a cheaper version of Mutual Fund's with less management.
Here are some crazy stats that should tell you a little about what has been happening in Japan:
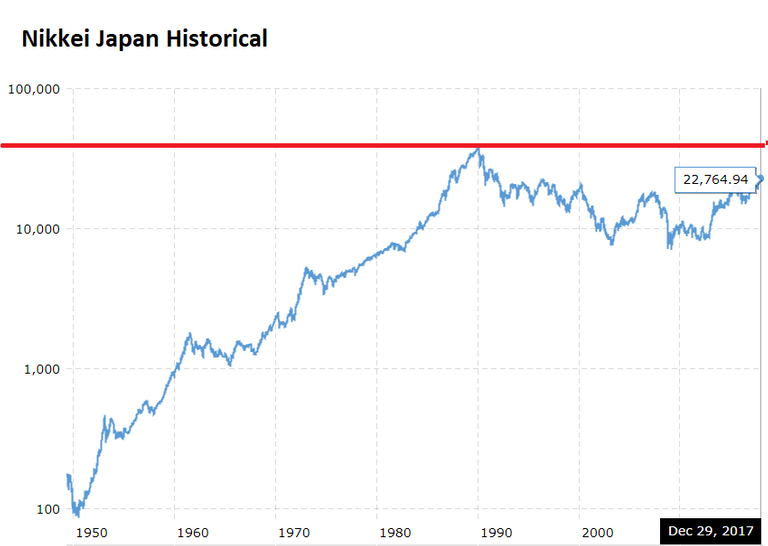
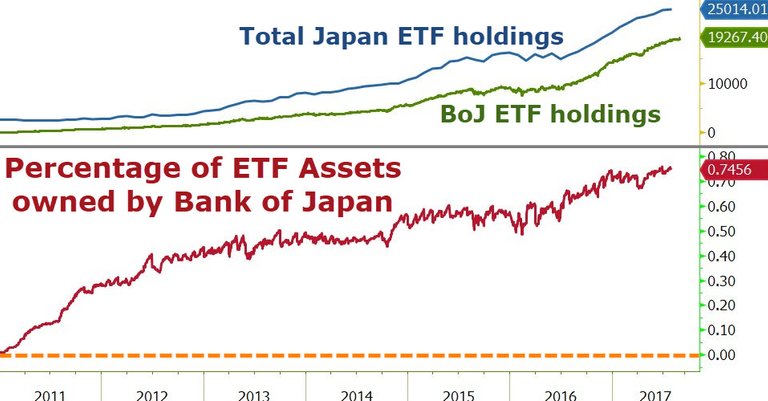
The Article I pulled the ETF numbers from is from September 11, 2017, so the numbers might be higher. https://www.zerohedge.com/news/2017-09-11/wtf-chart-day-boj-now-owns-75-japanese-etfs The crazy thing is that BOJ own 75% of the total ETF Markets. That is crazy, but if you read my article on how banks will hold everything then nothing you will understand what the Central Banks are doing to mitigate the risk of market crashes. Japan hasn't bounced over its old all-time high as Japan is struggling with a significant ageing population. There are many more countries like the US, Canada, Germany and others that are heading the same way. That is why you see mass puss for immigration to save their failing debt infused economies.
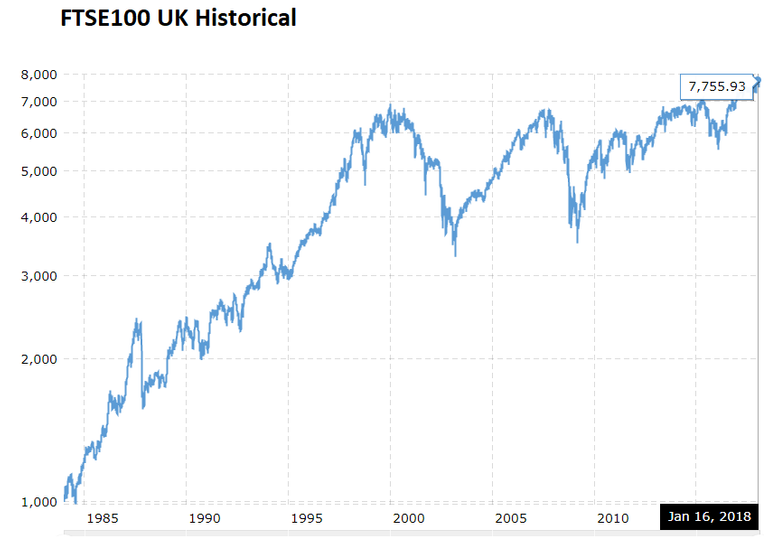
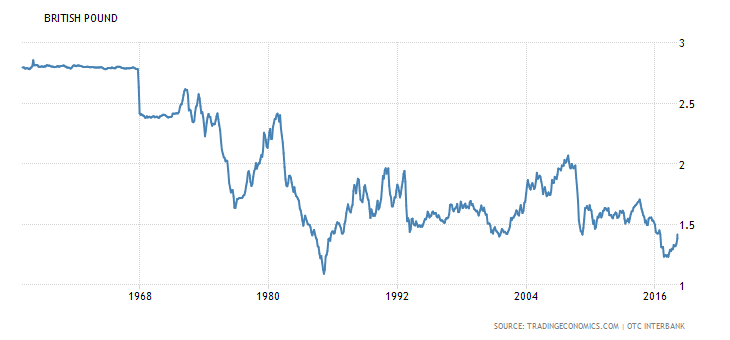
Next on the line is Great Britain. The British Economy has been stricken with inflation ever since the referendum to leave the EU European Union. The Pound has crashed in value vs. other currencies. Meanwhile, their stock market has been stagnant since 2000. The Stock markets are only up 10.36% over the last 18 years. That is nothing if you consider fees, inflation and taxation the average person will pay for their pension schemes. Britan is struggling with a small population and no innovation except that out of the Derivatives departments at Barcley and RBS.
Their population is in deflation and need to withdraw capital for retirement. That has dragged unwitting investors into Junk Bond or Equity investing when they should have been in Bonds that are more "secure." The UK was an old Empire. Their currency value lives with their empire, and over the last 30 years, their currency has become less and less valuable against other currencies while their populace is struggling to pay their bills with value losing Pounds.
Next on my radar is France. Very similar to Britain. I forgot to mention the thriving automobile industry in Britain that was killed by an astonishing 95% to tax in the 60's. The Beatles even wrote a song about it as this high taxation also hit them. Talking about high taxation. That is one of the primary reasons why I think Frances economy has stayed stagnate since 2000 as well. Together with a slowing population and a vast government to run things. Innovation and productive people have left France. Peugeot, Citroen, Alcatel and other prominent French corporations are not what they once were as a business in France is dead from government interference.
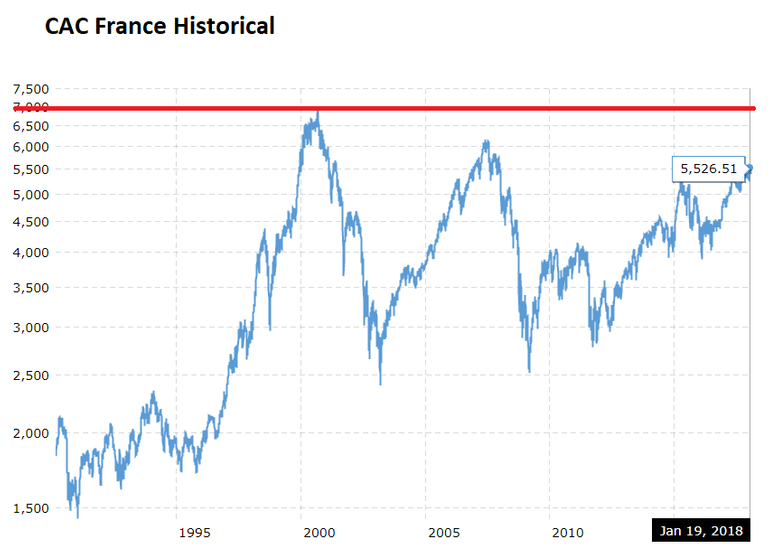
If we look at their stock market, you have negative growth for those who invested their life savings in stocks. French do not like the stock market. Almost 75% of savings in France sits in banks in savings accounts, not in their CAC stock market and that is probably the main reason since 2000 that the ROI Return On Investment is -17.20% and if you count in inflation, fees and taxation. You get the picture. Even though the market looks undervalued, France has a P/E ratio at 19.3 considering the SP500 average of 16.8 this is slightly overvalued.
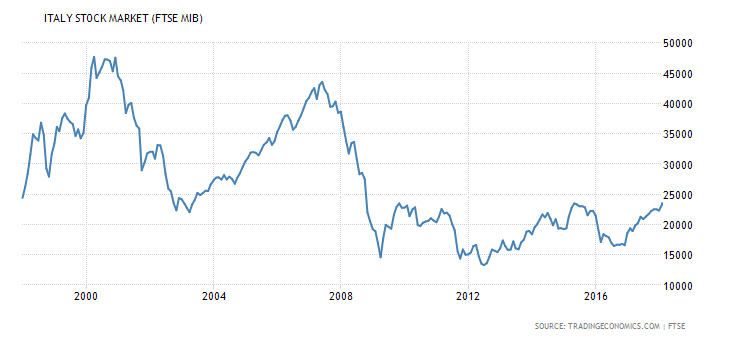
Now that I touched upon France, I wanted to mention Italy. Above I said how the Bank of Italy their central bank has been buying specific stocks in the US. Italy is the most overvalued stock market currently with a P/E ratio of 36.6. Italy is, of course, the place in Europe with the worst banks. There has been several bank bailout one being the oldest bank in Italy Monte Paschi Di Siena which was created back on March 4th my birthday back in 1472. The banksters from that time were the first to lend money to the populace, and they had issues back then. The bank has been bailed out several times.

Italy is known for its corrupt political system and of course a lot of mafia controlled economies inside Italy. And there is no surprise that Italy is one of the most likely markets in the Eurozine to fail. Even though with the Italian stock markets being low in compared to 47000 in 2000 and 43000 in 2008. Now the current value is 2354. Investing in the stock market for the long term in Italy has destroyed the savers.
Next up is China. China is a State Capitalist more borderline communist. The Chinese economy is heavily managed and controlled. Their Shanghai stock exchanges have since 2008 had another big crash in June 2015 and is down substantially from its 2008 high.
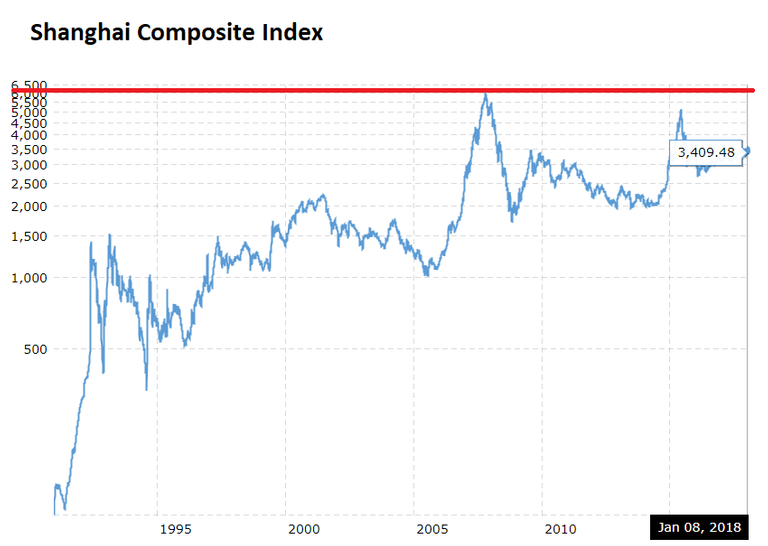
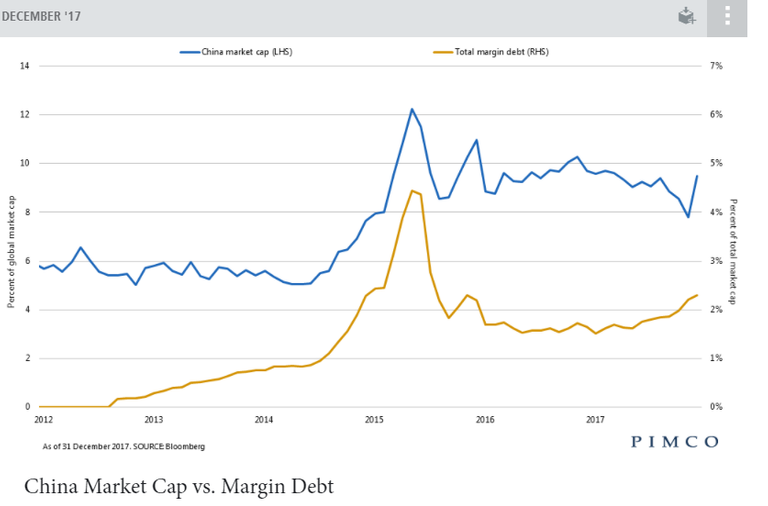
China has been building ghost cities and infrastructure to prop up its SOE State Owned Entreprises, so they don't go bankrupt. Debt has had a stranglehold on the Chinese economy, and since 2015 the bubble slowly popped into the business that had extended their credit without no real demand being created. Margin debt used on the Shanghai exchange is staying high as well.
China is trying to become the next world Super Power after the US falls in the coming decades. China has been working on a side infrastructure system with the AIIB, One Belt One Road, BRICS, SCO and of course the new gold and oil exchange. Also, China is creating Yuan Swap lines with other countries to avoid the US Dollar.
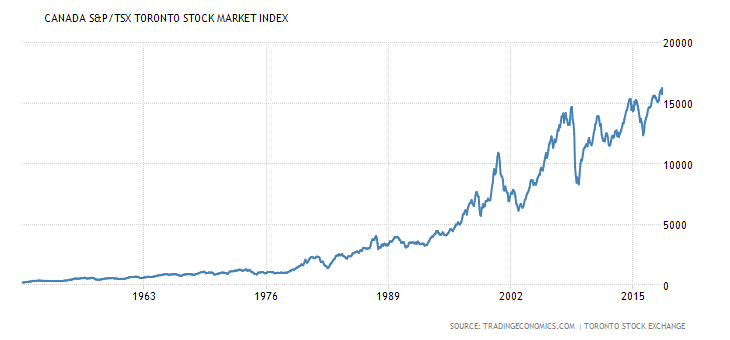
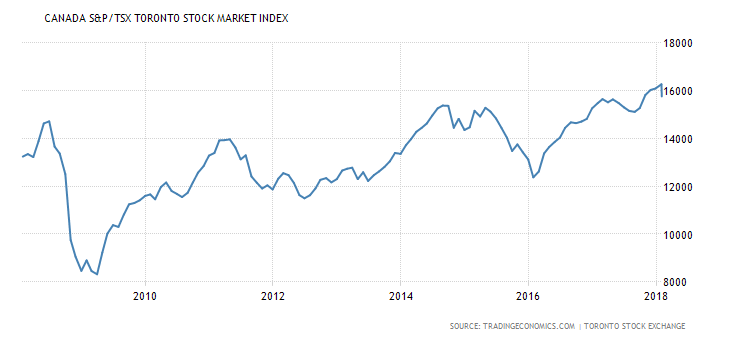
I could have added India, Germany and Canada, but I had to stop writing. I need to get this post out so the populace can gain an understanding. I will mention that Canada's TSX exchange has been stricken over the last week. I see risks in all of these economies as both Canada and India has high inflation created from Central Bank intervention.
I do want to mention that Germany had some big banks on the verge of bankruptcy. Deutsche Bank is the work, but also Commerzbank also has several issues with debt borrowed to southern European governments that are bankrupt. It is just a question of when Greece, Italy, Spain and other nations will default on their debt. It gives the German stock exchange DAX a worrisome future. Since 2000 there has been little gain annually same as many other countries exchanges.
Germany is the most prominent funder of the 4th Reich the EU and with former Nazi heir Jean Claude Junker at the helm the European Union looks to become what Hitler wanted to accomplish back in the second world war.
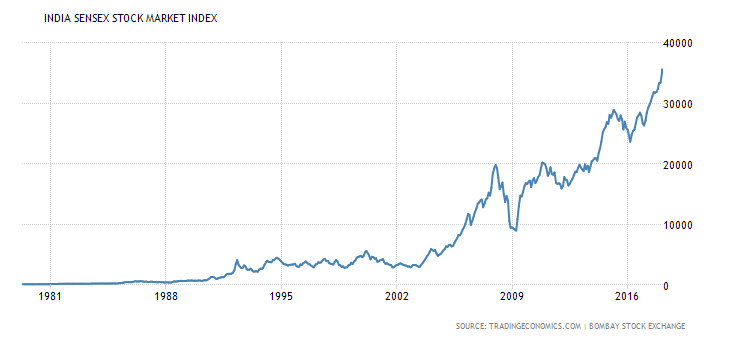
India is working hard to enslave their population and with high inflation and a push to eliminate cash in the Gold capital of the world India's Modi is facing a fightback even though he is implementing big government tracking apparatuses through Cashless and The Adaahr System. India will continue to destroy its currency. Since 2006 this has caused the Rupee to force SENSEX their Exchange up a whopping approx. 350% gain. It is the most significant gain by far of any of the exchanges I have walked you through. The destruction of Rupee value is the leading cause of the rise as I showed above the Venezuelan Stock exchange is up 10k+%.
The stock is a derivative of a business. And you should look at maybe creating your portfolio outside of the bankster and government boxes.
Peace, Love and Voluntaryism,
John
Inflation happens when you inflate the currency. I think our currency would work much much better if we had a balanced budget and 0 inflation.
This is a great counter argument to mainstream investment advice. I don’t know why anybody would want to listen to people like warren buffett telling them to park in indexes forever when things are so obviously gamed.
I definitely see a lot of alarm bells going off. Question is will we see a scare dip & slingshot ala the start of 2016 or will it be something more significant this time?
Time always tells, I’m inverse 😎
Thank you!
Excellent work. Your analysis is quite extensive and well reasoned. The quantitative easing will be tremendous after the domino crash occurs. God help us all.
Just great John! Glad to see you here on Steemit!