
Climate is changing. The charts you see show how climate has changed in the past 137 years. We are in a year of record temperatures (again) and the month of March has not been very different from the previous ones, the past month of March has been the warmest in the past 200 years.
In March alone, our planet had an average temperature above 1.05°C to the historical average of the last 100 years. First time ever this average is more than 1ºC above the average (except the El Niño phenomenon).
If we go back a bit further and look at measurements from the pre-industrial era, March has been 1.3°C above the average. If you were born in 1964, you have not lived in any month of March that has been below the historical average.
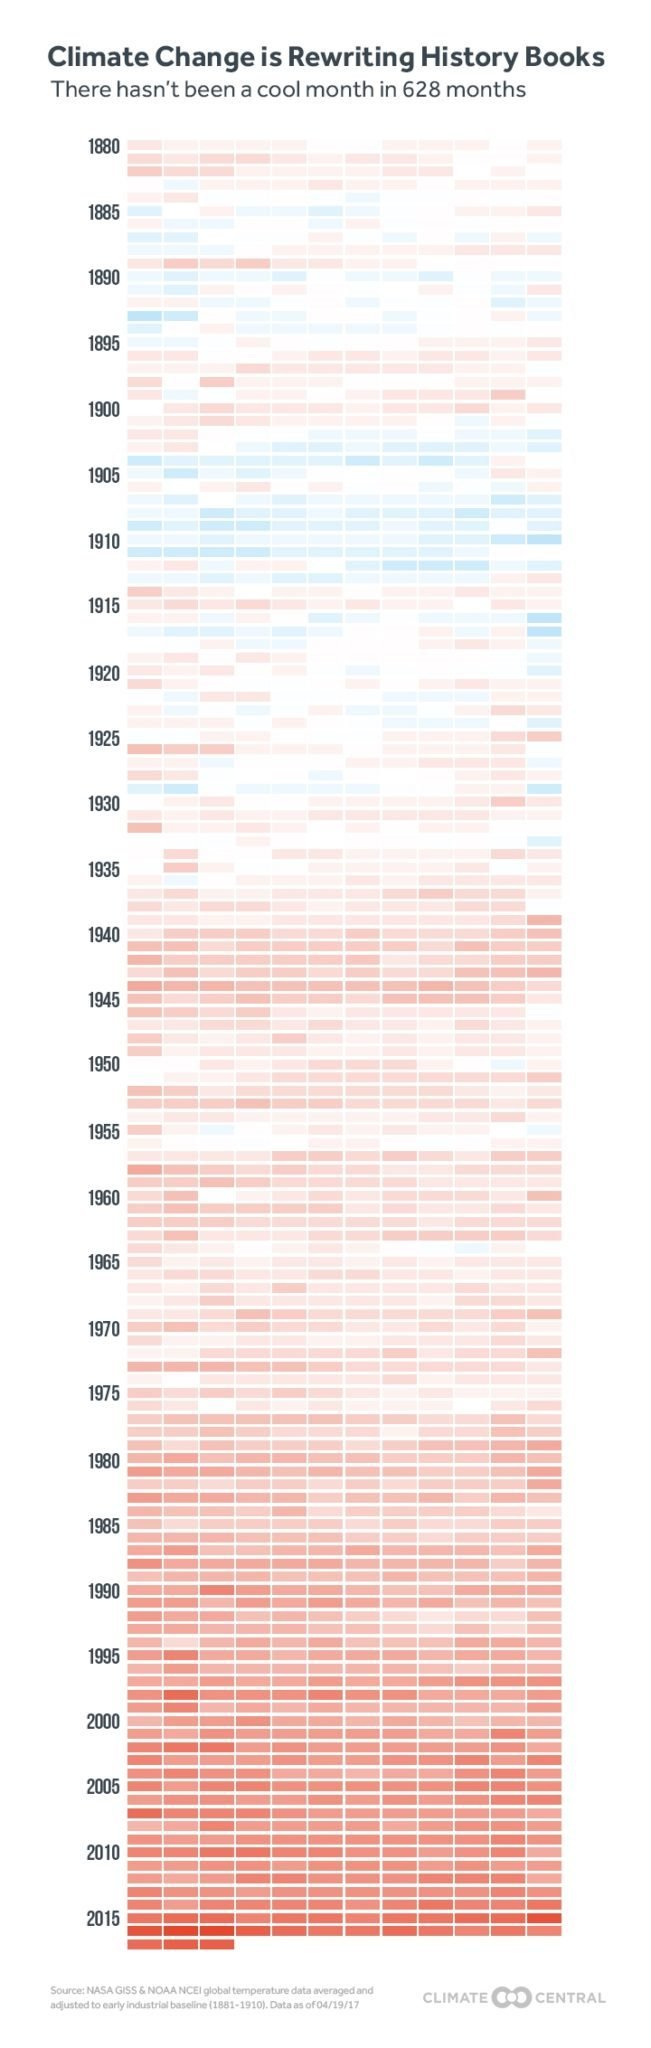
The below chart shows each month in a box, if the box is blue, means the temperature was below average, if red, above average. Will let you draw your own conclusions:
Welcome to the platform, I wish everything work out for you. It’s not easy here but not difficult neither but just ask an extra effort, engagement is the key good luck I’m @goodaytraders Start by following people and they will do the same.