Wild Flowers and the Discrete Statiscian


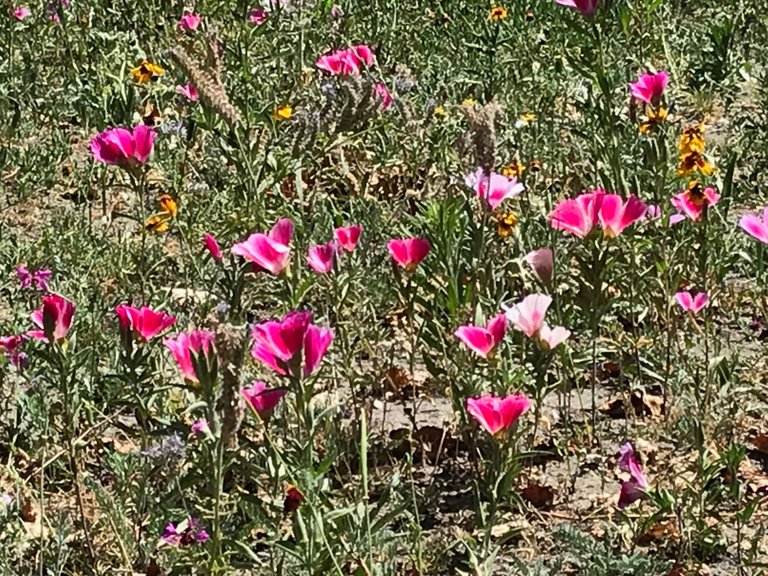
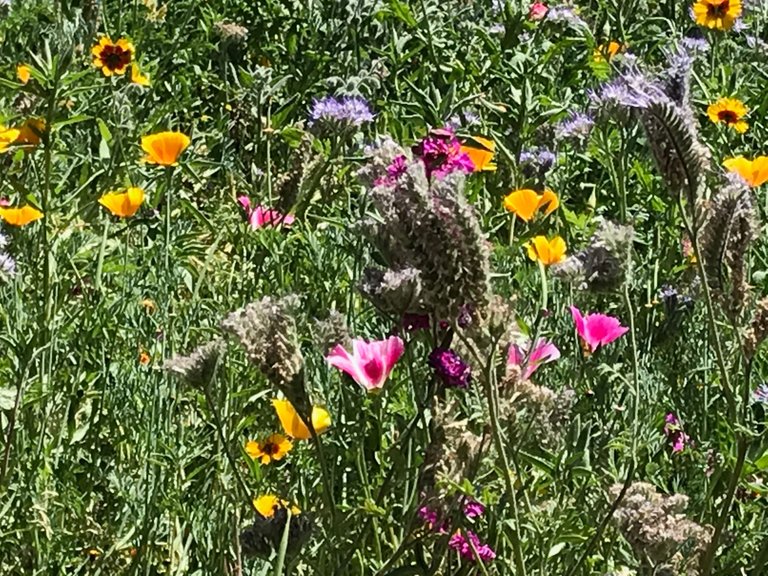
A pro-environmental activity I just love is the planting of wildflowers in urban environments: in other words the creation of a meadow on the side of a road or in an under-utilized green-space.
Not only do the fields grow delights for my eyes and inspiration for my pen and lens, but also nectar and pollen for the birds and bees.
What would we eat without bees and other flower acolytes?
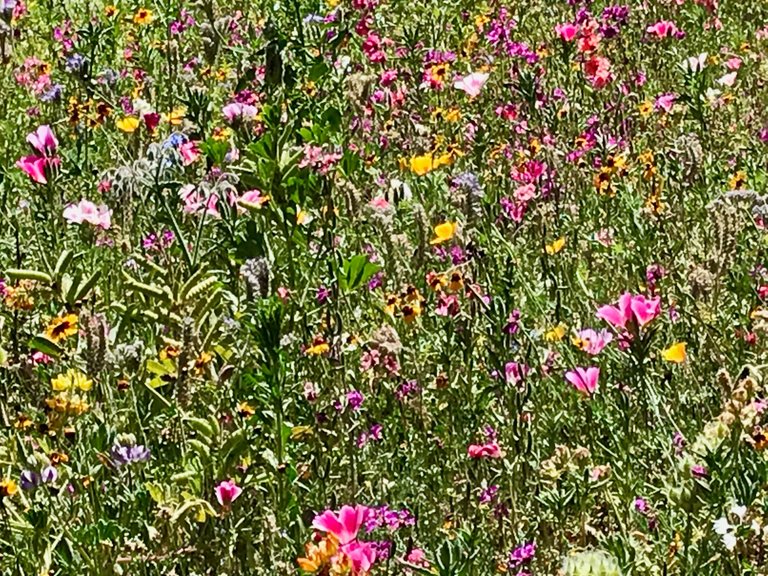
It is so much more pleasing, come mid-summer eve, to spy upon a field of rosé, sunny lemon, periwinkle, and indigo blooms than a dry patch of browning grass.
The indigenous flowers do not require watering and fertilizer. They drink from the earth, burrowing deeper with their roots than a lawn of Kentucky blue ever could. You make top soil and sequester topsoil that way. A process as old as terrestrial life and aided with the pasturing of animals. Insert Canadian-snow geese hybrids, in lieu of ruminants, and the Honk Squad's little tubular -so they'll know we were here- artifacts. One species refuse is nature's appetizer. Yuck, but true. Perhaps some sheep or goats wouldn't be a half-bad idea. I could use a new sweater and some cheese. What Vancouver needs is more shepherds, if you ask me. Next year, maybe.

Alright, enough time in the meadow and at the vane voyeuristic attempt to catch a glimpse of a bumble's belly button.
Time to share some of our homeschooling with those of you looking for a way to keep your minimes' minds sharp and expanding during the long Dog Days of summer. Warning statistics ahead.
From our studies ...
Numerical or quantitative data can be sorted into discrete or continuous. Discrete data has fixed finite values in a specific range. Only a limited number of data is possible in the specific range. An example is the number of students in a class. Discrete data cannot be broken down into smaller parts; it consists of distinct or unconnected elements. Discrete data does not change with time. Bar and pie charts are a great way to visually represent discrete data. A line graph is not as good because the data only represents singular plot points and not a continuous trend. Discrete data is counted and not measured. This kind of data can be whole numbers or any kind of fixed numbers, like shoe sizes.

Continuous data has infinite values between two distinct points. It can be any decimal or fractional value within a specified range. An example would be the weight of children in a class. These are data that we can measure rather than count and break down into smaller parts to make them more precise/exacting. Line graphs, scatterplots and histograms are a good way to represent continuous data.
Continuous data generally changes with time, for example temperature.
Primary data is collected by the researcher from direct/primary sources. Secondary, sometimes called metadata, is collected from studies, papers, survey, or experiments done by other people, in other words data derived from data.
Examples of secondary data:
- Encyclopedias
- Essays
- Newspaper opinion pieces
- Reviews
- Textbooks
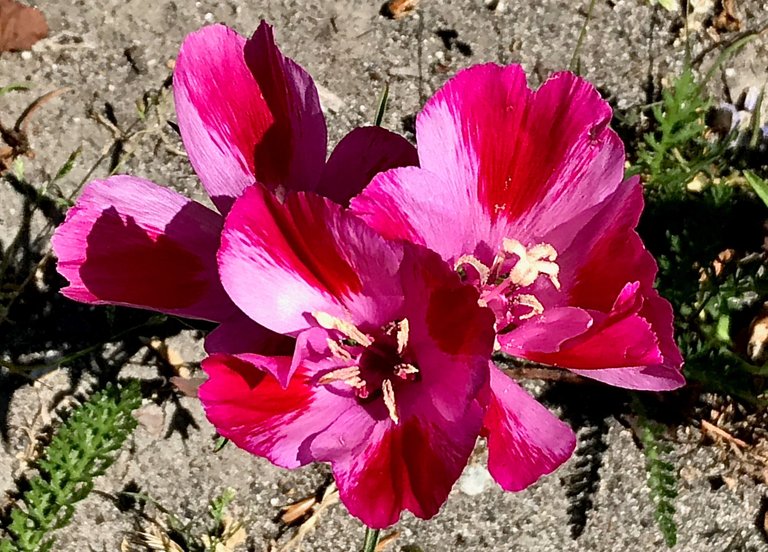
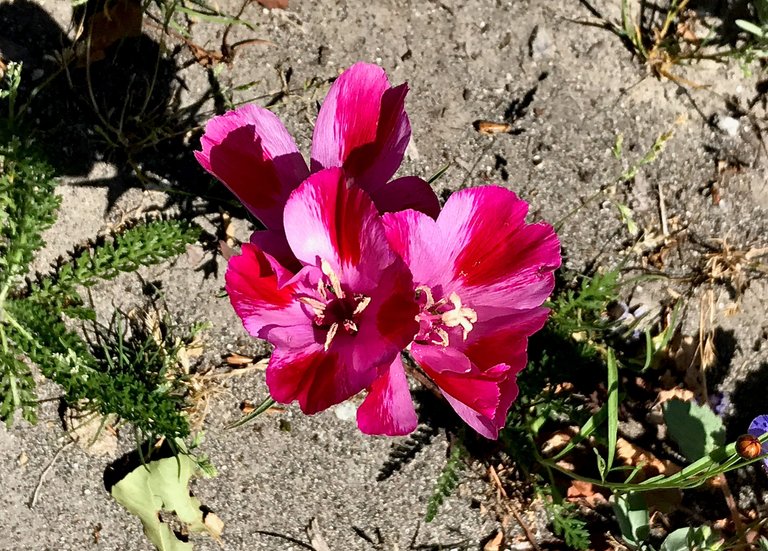
discrete petals, continuous roots
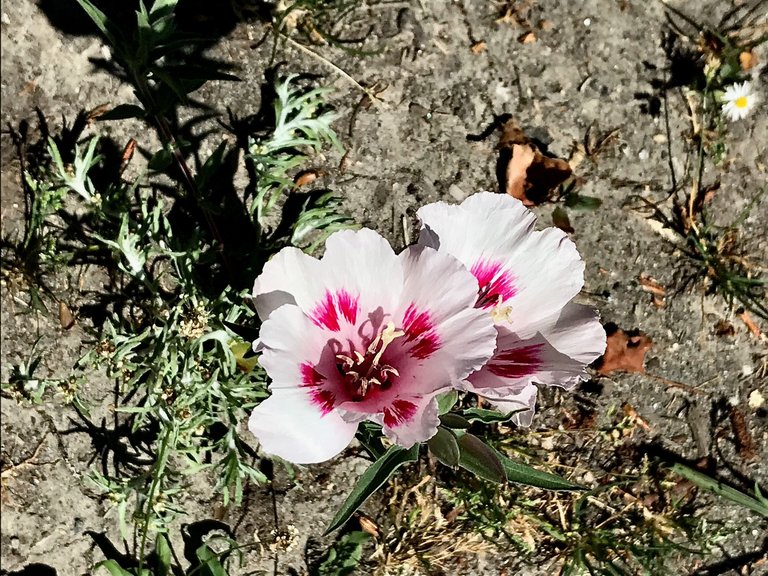
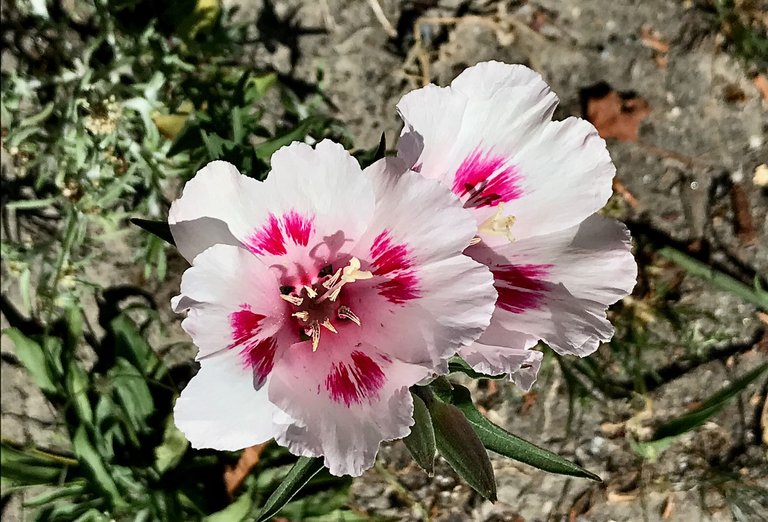
rock turned to soil
***
Words and Images are my own.
Click on any title below to further explore and support my writing.


Wao always see the fresh flowers its helps us to refresh our mind.
Thank you:)
Most welcome.
Congratulations @prydefoltz! You received a personal badge!
Wait until the end of Power Up Day to find out the size of your Power-Bee.
May the Hive Power be with you!
You can view your badges on your board and compare yourself to others in the Ranking
Check out our last posts:
Congratulations @prydefoltz! You received a personal badge!
Participate in the next Power Up Day and try to power-up more HIVE to get a bigger Power-Bee.
May the Hive Power be with you!
You can view your badges on your board and compare yourself to others in the Ranking
Check out our last posts: