Let us continue reproducing @arcange's statistical reports in Python. Recall that in the previous post we counted newly registered and total users on the site. The next step is counting active users on each day and month.
Preparation
Just like in the previous post, the code is meant to be executed interactively in a Jupyter notebook. We start by preparing the database connection and the plot styles (see the previous post for explanations):
%matplotlib inline
from sqlalchemy import create_engine
import pandas as pd
import seaborn as sns
sns.set_style()

url = 'mssql+pymssql://steemit:[email protected]/DBSteem'
e = create_engine(url)
Counting Active Users
There are two main kinds of activity on Steemit that we are interested in - posting and upvoting ("curation"). All the posts and comments are recorded in the TxComments table with its timestamp and author fields, while all the upvotes go into TxVotes with timestamp and voter. To count the number of active authors and voters on each day we thus just need to make two aggregating select queries as follows:
Active authors:
q = """
select
    cast(timestamp as date) Day,
    count(distinct author) as [Active authors]
from TxComments
group by cast(timestamp as date)
order by Day
"""
active_authors = pd.read_sql(q, e, index_col='Day')
Active voters:
q = """
select
    cast(timestamp as date) Day,
    count(distinct voter) as [Active voters]
from TxVotes
group by cast(timestamp as date)
order by Day
"""
active_voters = pd.read_sql(q, e, index_col='Day')
Finally, to get the list of distinct users who either voted or posted something, we may simply aggregate the union of the two tables. It may not be the most efficient way of querying this data, but it does the job within about 1.5 minutes, which is probably fine:
Active users:
q = """
select
    cast(timestamp as date) Day,
    count(distinct name) as [Active users]
from (select timestamp, voter as name from TxVotes
      union
      select timestamp, author as name from TxComments) data
group by cast(timestamp as date)
order by Day
"""
active_users = pd.read_sql(q, e, index_col='Day')
Now that we have the data, all that remains is to join the three tables together:
df = active_users.join(active_voters).join(active_authors)
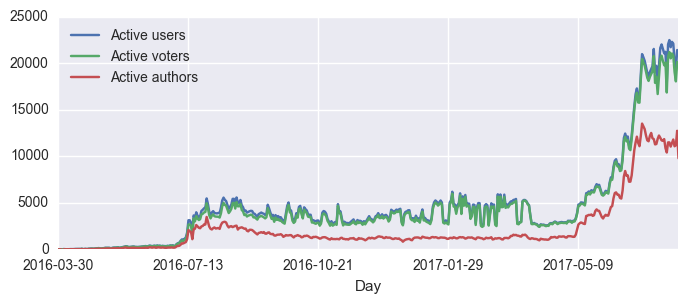
and plot the chart for either the whole history:
df.plot(figsize=(8,3))
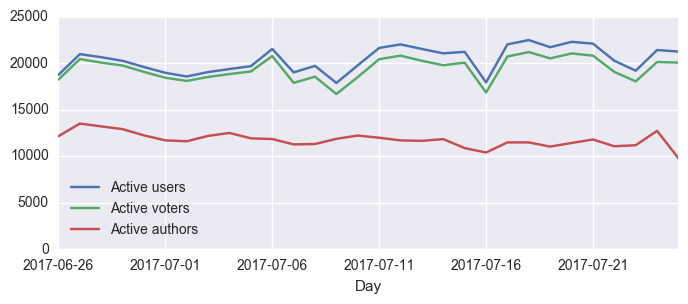
or only for the last 30 days:
df[-30:].plot(figsize=(8,3), ylim=(0, 25000))
Active Users per Month
To get the monthly active user counts we may repeat essentially the same queries with a different group by condition:
Active monthly authors:
q = """
select
    year(timestamp) Year,
    month(timestamp) Month,
    count(distinct author) as [Active authors]
from TxComments
group by year(timestamp), month(timestamp)
order by Year, Month
"""
active_monthly_authors = pd.read_sql(q, e, index_col=['Year', 'Month'])
Active monthly voters:
q = """
select
    year(timestamp) Year,
    month(timestamp) Month,
    count(distinct voter) as [Active voters]
from TxVotes
group by year(timestamp), month(timestamp)
order by Year, Month
"""
active_monthly_voters = pd.read_sql(q, e, index_col=['Year', 'Month'])
Active monthly users:
q = """
select
    year(timestamp) Year,
    month(timestamp) Month,
    count(distinct name) as [Active users]
from (select timestamp, voter as name from TxVotes
      union
      select timestamp, author as name from TxComments) data
group by year(timestamp), month(timestamp)
order by Year, Month
"""
active_monthly_users = pd.read_sql(q, e, index_col=['Year', 'Month'])
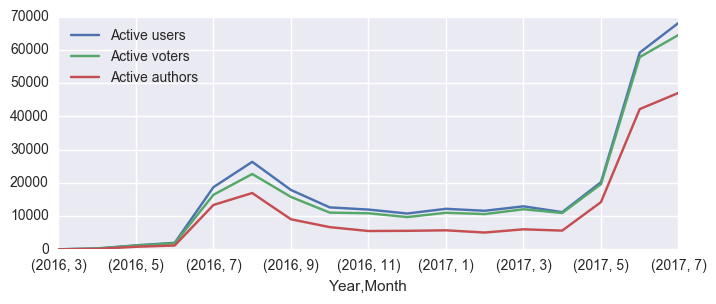
Now join and plot as before:
df = active_monthly_users.join(active_monthly_voters).join(active_monthly_authors)
df.plot(figsize=(8,3));
To add the actual numbers of users to the plot, we can, for example, do the following:
ax = df.plot(alpha=0.8,figsize=(8,3));
au = df['Active users']
au.plot(style='.')
for i in range(len(df)):
    ax.annotate(au[i], xy=(i, au[i]+1800), ha='center', fontsize=8)
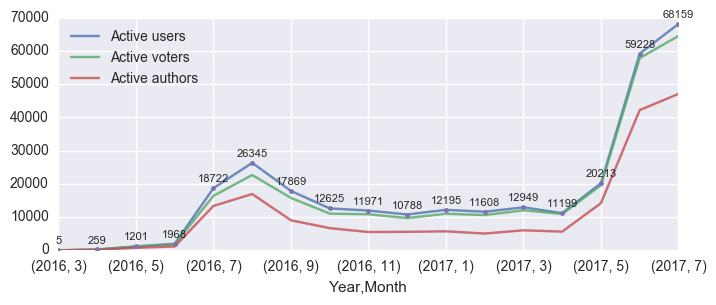
Note that the numbers are a tiny bit higher than those on the @arcange's report. Not sure what the reason for this discrepancy might be, I hope @arcange himself might find the time take a look one day.
That is probably enough for now. Let us continue reproducing the other @arcange charts in the following posts. The presented source code is also available as a notebook on Github.
That's cool, combining steemit and python, thanks.
I don't have Jupyter notebook installed but I have all libraries installed so I will see if I can follow you with the IDE. For a beginner in Python like me, this looks perfect :-)
Jupyter is also a python library. If you have Anaconda, then you have Jupyter installed already. If you do not have Anaconda (e.g. you started with a barebones Python installation), you can install Jupyter by typing
Then run it as follows:
It should open the browser with a list of files in the current directory. Create a new notebook, and there you go.
I tried it once and I just couldn't get used to it, but I may try again if my ide will not be up to task :-)
I strongly suggest you try again. At the moment Jupyter is the main tool for interactive data analysis in the Python community (and not only). Knowing your way around it is a must.