by @Altherion

Scientists do experiments every day. The nature of experiments is that every time an observation is made there is also an error in the observation. Scientists have found ways to minimize the impact of errors on their data collection and the accuracy of drawn conclusions. To better understand experimental errors I will describe the two type of errors that are encountered. These two types are systematic errors and random errors. A gravimetric experiment will be used as an example. The example is weighing glucose with a scale. For our hypothetical experiment we need five samples containing 5.00 grams of glucose.

A typical lab scale. SOURCE
Systematic errors
Systematic errors are errors where the mean of the deviations is non-zero. This means the value that is measured is consistently either lower or higher than the true value. Such errors are commonly introduced as offsets due to imperfect equipment or neglected influences. Besides offsets, inaccurate scaling of a measured quantity is also a variation of systematic errors.
Offsets and scaling can be explained by our glucose weighing experiment. We set up the scale, place the weighing dish, and press ‘TARE’ to set the scale to zero. As we take a spoon and prepare to add glucose the scale reads 0.01 gram. It is not properly tared, with a positive offset of 0.01 gram. If we would take samples when the scale reads 5.00 gram then we actually have 4.99 gram. The good thing is that since we know our offset is 0.01 gram we can simply take samples at 5.01 gram. This is the good thing about systematic errors. Once we have identified that they are there, we can often easily correct for them.
Scaling is a little trickier. We assume that for every extra gram of glucose we add to the weighing dish the scale display will also increase by one gram. However, during a regular checkup the lab technician finds that for some reason the scale is faulty. The display only increases by 1 gram when 1.05 gram is added on top of it. He concludes the scale display improperly scales (I already regret this example) with the added weight. Every sample of 5 gram we have weighed actually weighs 5 x 0.05 more, which ends up being 5.25 gram per sample. Knowing that this is the case we can adapt our post-experiment calculation to include the higher amount of glucose. Again the source of the systematic error is identified and we can find a way to correct for it.
Random errors
Random errors are errors where the mean of the deviations is zero. The error is randomly lower or higher and with enough measurements, it will average out. Sources for this type of error are inaccurate reading or statistical deviations such as vibrations or voltage fluctuations. The errors are random and unpredictable.
We decide to change the experiment and instead of weighing glucose as powder we decide to weigh it while adding it to water so it can dissolve faster. We set up the scale, place a beaker glass with 40 ml of water on top of the scale, and again we press ‘TARE’ to set the scale to zero. As we add glucose to the water we notice the display slowly decreasing. It turns out the water we use to dissolve the glucose is slowly evaporating! We quickly add 5 grams of glucose and try to get close to 5.00 grams. Because the display kept changing we ended up recording 4.96, 5.02, 5.06, 4.94 and 5.01.
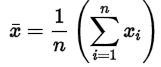
The data can now be expressed using statistics. It will be expressed as
a mean
and standard deviation.
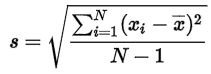
The mean is the sum of all five data points, divided by the number (five). The mean is 4.998, which due to significance is shortened to 5.00 (our scale only displayed two numbers after the comma). The standard deviation is calculated by taking the difference of every data point with the mean, which for the first one is 4.96-5 = - 0.04. The five differences are individually squared, and then they are added together. Subsequently the result is divided by the number of data points – 1 (four) and finally we take the square root. The resulting standard deviation is 0.048, which due to significance is also shortened to 0.05. The average value for all the five samples we have weighed is 5.00 ± 0.05.
References:
Experimental Errors and Uncertainty
Random vs Systematic Error
More from @Altherion
2017 – Obesity update
The Atwater Study
Sugary drinks #1
Sugary drinks #2
Website: FoodLabScience
Wow! Do these errors happen often in experiments/scientific discoveries? It seems to me that the worse of the two would be the random errors.
Would weighing an item on more than one scale/taking many samples of data from different places help minimize these errors?
Because scientists know these errors exist they try to think ahead of them. When designing experiments you already think about the things you mentioned, such as how many and what type of repetitions to do, the sample size to use, using multiple techniques to double-check values etc.
Designing proper experiments is an art in itself.
I see- that's genius! They must work very hard to perfect the right experiment.
Thank you i reestemed