The Basis of Technical Analysis.......................
At the turn of the century, the Dow Theory laid the foundations for what was later to become modern technical analysis. Dow Theory was not presented as one complete amalgamation, but rather pieced together from the writings of Charles Dow over several years. Of the many theorems put forth by Dow, three stand out:
1.Price Discounts Everything
2.Price Movements Are Not Totally Random
3.“What” Is More Important than “Why”
Price Discounts Everything
This theorem is similar to the strong and semi-strong forms of market efficiency. Technical analysts believe that the current price fully reflects all information. Because all information is already reflected in the price, it represents the fair value, and should form the basis for analysis. After all, the market price reflects the sum knowledge of all participants, including traders, investors, portfolio managers, buy-side analysts, sell-side analysts, market strategist, technical analysts, fundamental analysts and many others. It would be folly to disagree with the price set by such an impressive array of people with impeccable credentials. Technical analysis utilizes the information captured by the price to interpret what the market is saying with the purpose of forming a view on the future.
Prices Movements are Not Totally Random
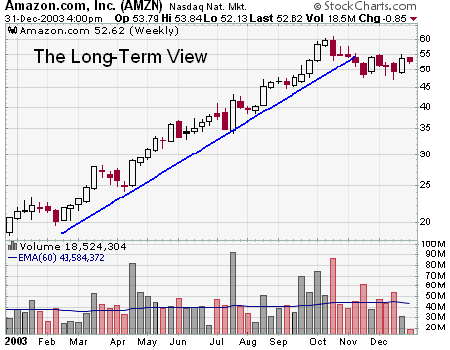
Most technicians agree that prices trend. However, most technicians also acknowledge that there are periods when prices do not trend. If prices were always random, it would be extremely difficult to make money using technical analysis. In his book, Schwager on Futures: Technical Analysis, Jack Schwager states:
“One way of viewing it is that markets may witness extended periods of random fluctuation, interspersed with shorter periods of non-random behavior. The goal of the chartist is to identify those periods (i.e. major trends).”
International Business Machines (IBM) Technical Analysis example chart from StockCharts.com
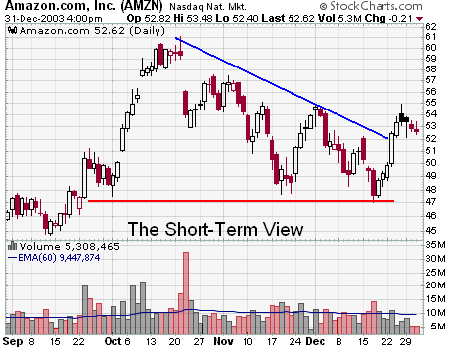
A technician believes that it is possible to identify a trend, invest or trade based on the trend and make money as the trend unfolds. Because technical analysis can be applied to many different timeframes, it is possible to spot both short-term and long-term trends. The IBM chart illustrates Schwager's view on the nature of the trend. The broad trend is up, but it is also interspersed with trading ranges. In between the trading ranges are smaller uptrends within the larger uptrend. The uptrend is renewed when the stock breaks above the trading range. A downtrend begins when the stock breaks below the low of the previous trading range.
"What" is More Important than "Why"
In his book, The Psychology of Technical Analysis, Tony Plummer paraphrases Oscar Wilde by stating, “A technical analyst knows the price of everything, but the value of nothing”. Technicians, as technical analysts are called, are only concerned with two things:
What is the current price?
What is the history of the price movement?
The price is the end result of the battle between the forces of supply and demand for the company's stock. The objective of analysis is to forecast the direction of the future price. By focusing on price and only price, technical analysis represents a direct approach. Fundamentalists are concerned with why the price is what it is. For technicians, the why portion of the equation is too broad and many times the fundamental reasons given are highly suspect. Technicians believe it is best to concentrate on what and never mind why. Why did the price go up? There were simply more buyers (demand) than sellers (supply). After all, the value of any asset is only what someone is willing to pay for it. Who needs to know why?
Please upvote and comment............
Thanks in advance..
Jogesh singla.
Hi! I am a robot. I just upvoted you! I found similar content that readers might be interested in:
http://stockcharts.com/school/doku.php?id=chart_school:overview:technical_analysis
Congratulations @jogesh.singla47! You received a personal award!
You can view your badges on your Steem Board and compare to others on the Steem Ranking
Vote for @Steemitboard as a witness to get one more award and increased upvotes!