I tried to show you the most important Classic Reversal Patterns of Technical Analysis with their 🎯Targets**🎯.
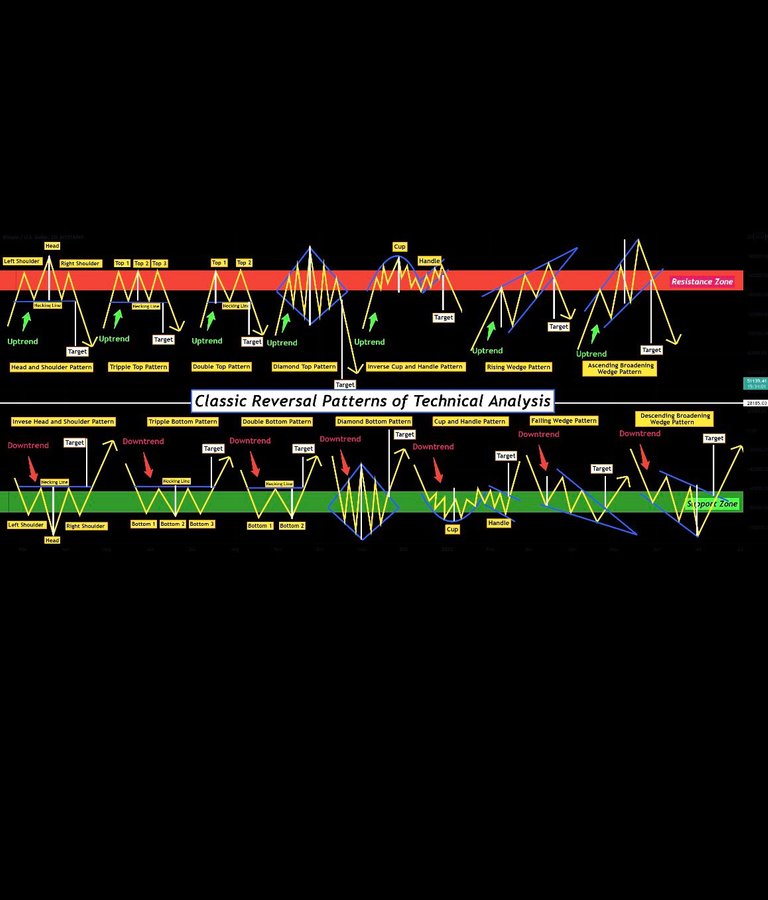
🔴A head and shoulders pattern is a chart formation that appears as a baseline with three peaks, where the outside two are close in height and the middle is highest. In technical analysis, a head and shoulders pattern describes a specific chart formation that predicts a bullish-to-bearish trend reversal (All definitions for Inverse Head and Shoulder Pattern are the opposite).
🔴The triple top is a type of chart pattern used in technical analysis to predict the reversal in the movement of an asset's price. Consisting of three peaks, a triple top signals that the asset may no longer be rallying, and that lower prices may be on the way (All definitions for Tripple Bottom Pattern are the opposite).
🔴A double top is an extremely bearish technical reversal pattern that forms after an asset reaches a high price two consecutive times with a moderate decline between the two highs. It is confirmed once the asset's price falls below a support level equal to the low between the two prior highs (All definitions for Double Bottom Pattern are the opposite).
🔴A diamond top formation is a technical analysis pattern that often occurs at, or near, market tops and can signal a reversal of an uptrend. It is so named because the trendlines connecting the peaks and troughs carved out by the security's price action form the shape of a diamond(All definitions for Diamond Bottom Pattern are the opposite).
🔴A cup and handle price pattern on a security's price chart is a technical indicator that resembles a cup with a handle, where the cup is in the shape of a "u" and the handle has a slight downward drift. The cup and handle are considered a bullish signal, with the right-hand side of the pattern typically experiencing lower trading volume. The pattern's formation may be as short as seven weeks or as long as 65 weeks(All definitions for Inverse Cup and Handle Pattern are the opposite).
🔴A rising wedge is a technical indicator, suggesting a reversal pattern frequently seen in bear markets. This pattern shows up in charts when the price moves upward with pivot highs and lows converging toward a single point known as the apex. Using two trend lines—one for drawing across two or more pivot highs and one connecting two or more pivot lows—convergence is apparent toward the upper right part of the chart(All definitions for Falling Wedge Pattern are the opposite).
🔴An ascending broadening wedge is a bearish chart pattern (said to be a reversal pattern). It is formed by two diverging bullish lines (All definitions for Descending Broadening Wedge Pattern are the opposite).
What about price?
Congratulations @nyclogic! You have completed the following achievement on the Hive blockchain and have been rewarded with new badge(s):
Your next target is to reach 200 replies.
You can view your badges on your board and compare yourself to others in the Ranking
If you no longer want to receive notifications, reply to this comment with the word
STOPCheck out the last post from @hivebuzz:
Source of plagiarism 1
Source of plagiarism 2
Source of plagiarism 3
Source of plagiarism 4
Source of plagiarism 5
Plagiarism is the copying & pasting of others' work without giving credit to the original author or artist. Plagiarized posts are considered fraud and violate the intellectual property rights of the original creator.
Guide: Why and How People Abuse and Plagiarise
Fraud is discouraged by the community and may result in the account being Blacklisted.
If you believe this comment is in error, please contact us in #appeals in Discord.