I recently noticed a fellow steemian using the SBD "convert to steem" feature. While this may be fine (and possibly even advantageous) to do when SBD is trading at a discount, you're literally throwing away money if you do it while SBD's trading at a premium, as it is currently.
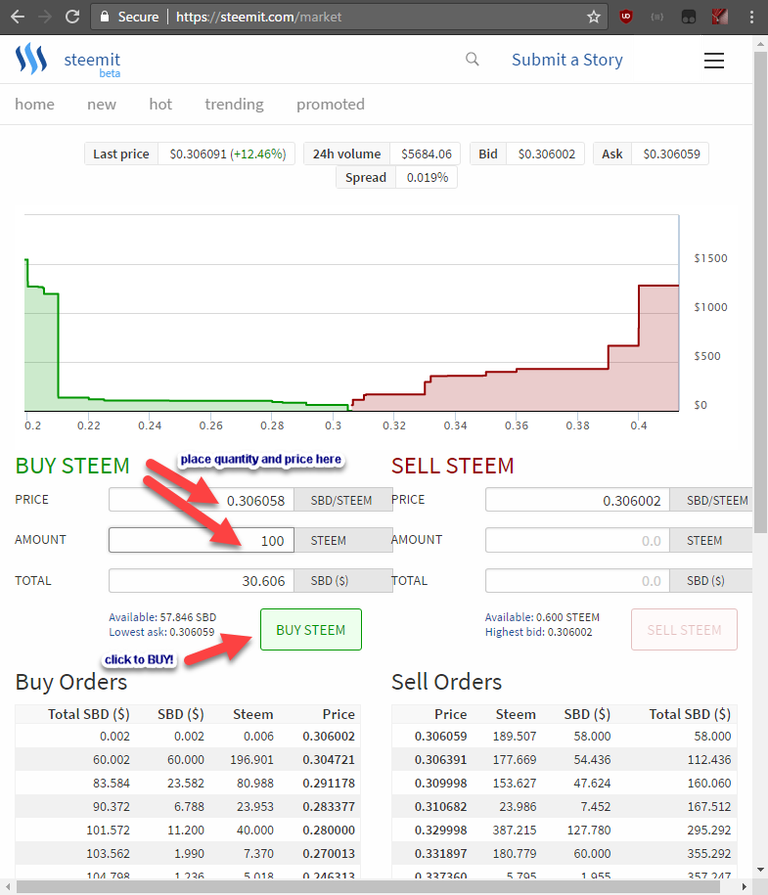
Based on the conversion rates he was receiving for SBD he already owned, he was paying almost 29 cents worth of SBD per STEEM, whereas he could have purchased that same STEEM using the internal STEEMIT market at https://steemit.com/market for 21 cents SBD per STEEM. That would imply he was overpaying for his extra STEEM by nearly 40%!
And if you consider he could have attempted to BID for a better price on the market as well, versus outright taking the offer, the savings would be even higher. Furthermore, if he were to continue using the conversion feature since yesterday's continued STEEM run-up from around 21 cents, he'd likely be overpaying by around 50% (since SBD has also become more valuable versus actual US $dollars)! You can calculate this yourself by converting Poloniex's SBD/BTC price back to dollars ( 0.00096949 x 1575 = $1.53 ).
While I'm by no means suggesting anyone to buy into more STEEM at these elevated prices just after such a quick run-up, some people seem to use the feature to convert their extra SBD to STEEM without realizing how much of their hard-earned crypto cash they're just tossing away. And nonetheless, it's important for all steemians to understand this regardless of the current STEEM and SBD price.
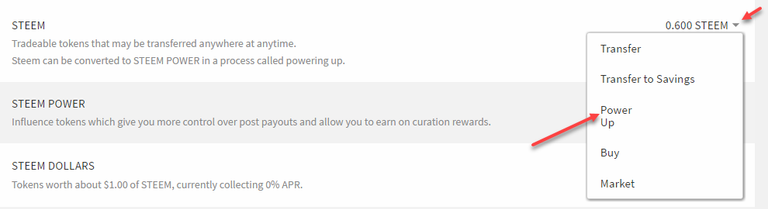
Once you've converted your extra SBD to STEEM, you can also easily power it up (if you choose to do so) by going to your Wallet, clicking the little down arrow next to your STEEM balance, and clicking Power Up. Then, just complete the form and you're good to go!
Buy from the market easy and quick.Thank you for your explanation
Yes, you can send SBD to bittrex and convert sbd to btc. Then you can bid for a good price.
Thanks for the post of explaining converting SBD to steem.
Wanted to drop a line saying thank you for this post. It was the most helpful from my quick search on how do to this. Even with this post being beyond it's payout period, wanted to let you know!
thank you @gerenacrehome, glad to know you found it so helpful!
And while were on the subject, if you trade on Poloniex, DO NOT buy steem there! Price is always higher@Polo. Instead, convert Btc into SBD then transfer SBD on over to Steemit to then use the built-in internal market ;)
Personally I find this all to complicated. Why are there two ways of converting. With such a significant difference in value. Who is ripping who off. In my mind this is a part of the sham of banks we are trying to eliminate.
This is an excellent guide that explains the differences between STEEM the crypto-currency, versus its associated "smart contracts", STEEM POWER, and SBD (STEEM-BACKED DOLLARS):
Link: Steemit Financial Instruments: Steem, Steem Power & Steem Dollar Explained
I am really getting a lot out of such amazing advice. Thanks!!
for a bit more on this topic, I just happened to stumble onto this post as well...
Link: Attention SBD Converters: Please Read - Important Information about SBD -> STEEM Conversions
I do remember reading this article and took his advice understanding better how it all works
I like your personal financial advice, that is sound...
However, a person converting sbd to steem, at the value of $1 worth of steem and during a time that sbd is worth more than $1, is infusing value into the steem network.
But the steem network no longer has this option available on the website, so I suppose both our points are moot at this time.
Probably the development team has a trade-bot. I mean there must be somebody doing the trading on steemit.com. These will certainly earn on the basis of arbitrage.
there is a market maker bot run by @smooth and probably a few others.
Okay :-)
Thanks for link Alex. Excellent advice :)
Can't be stressed enough!
I followed the links to the internal market, and converted 60 SBD to Steem at the offered price (this was my very first transaction, and I didn't want to complicate it any further than necessary, as I have long been holding off on any cryptocurrency transactions due to my ignorance and anxiety).
SBD was over a dollar, and it seemed that, according to your explanation, I would improve my account balance by doing it before SBD drop to parity (that being so I wish I would have done so earlier when SBD was much higher).
Anyway, I fear I may misunderstand how things work, as my account balance seems to have dropped, instead of increased, in terms of it's dollar valuation.
Am I misinterpreting things, or just expecting the wrong result, or what? I assure you I was pleasantly surprised at the ease of the transaction, and regardless of my potential misunderstanding, in no way intend to compound my ignorance by considering blaming anyone but me for that ignorance.
Sorry if I appear to be asking for handholding services, but I simply am anxious about having misunderstood, or somehow having done something wrong. I'd appreciate any clarity you might be willing to throw my way.
Thanks!
I seem to have decreased my account value by $40 - $70 by buying Steem with my SBD on the internal market yesterday. If you have any insight as to why this unexpected result occurred, I'd really appreciate hearing it.
SBD was ~ $1.20 at the time, IIRC, so I thought I would increase my account value by ~ 20%, or so (Steemit valuing SBD @ $1, I thought).
So, some part of my understanding was very, very wrong.
The "Estimated Account Value" that you see displayed in your wallet is calculated as the 7 day average value of STEEM, which has been going down the past few days.
However, on the internal market, the value of SBD (since they've been "printing" more of them, has been going down versus STEEM). On the internal market, it looks like from one of your trades, you sold 61.878 SBD to receive 34 STEEM, which is equivalent to a rate of 1.81 SBD / STEEM.
Now, I don't think this is even reflected for you yet, but the price of STEEM also just tanked 20% on the internal market versus where you traded your SBD as well, which can be attributed to a bit of bad timing. That's also why if you are looking to convert and can afford to wait, it's usually worth holding out for "tanks" such as these to take place before making your exchange. Of course, one never knows for sure, and it can keep going up. But usually you'll get at least a short "panic" opportunity at some point to catch a better price...
Thanks very much for your insight. SBD had been steadily decreasing in value, and I expected that sooner was better than later to make the transaction. Clearly I was shooting at a target I could not see.
Where do you get that chart? Also, it is rather busy. None of the plots are labeled, so it is as opaque as my last (and first) trade was to my understanding.
I expect you are correct about the price of Steem impacting my account value. The loss seemed to be entirely caused by my trade, and I do expect further account value decrease as a result of Steem losing value.
The chart is from my trading platform tymoraPRO. All the indicators I use (besides following the raw price action) tend to be related to identifying a volatility distribution on the move, and also help identify when prices reach extremes on a various time frames.
This chart has lower band GMMAs, 5/8/34 ohlc XMAs, VolSqueeze (combination of acceleration bands and bollinger bands), VWAP, Volume/VolMA (volume moving average), VolTrails (volatility trails that track a sort of "pain point" for traders, sort of like a multi-timeframe version of Chandelier Stops), and VolByPrice (volume by price on the right). I could write several posts just on each of those!
But that should be enough for now if you want to google around a bit. Also, once you've studied trading long enough, you start to quickly get an idea all the indicators being used. Having each one listed on a chart often just takes up extra space. Here's one though with a bit less going on!
Wow! when you said 'your' trading platform I did not realize you meant one you had created.
Even though I need to put down my voting, I voted you up, just cuzza dat. Very awesome platform.
I do understand that YOU understand the chart without needing to label the various plots.
I don't. However, this, and the one you posted before, just at a glance, seem to show that price plunged just prior to my transaction. Had I known this, I, even I, would probably have been able to hold off on the transaction.
That alone would have saved my account at least $40.
Thanks! I very much appreciate your consideration.
Yeah, there was quite a bit on there, so I know where you're coming from. Bigger point I was getting at was really just to show you the price action.
Glad you found my responses at least somewhat helpful, and thanks for the upvote! :)
btw, on the 5m chart I posted, notice how as price rose back above those "levels", what's happened since then... back to nearly $1.50 again!
yes. LOL this was my point about my personal luck when it comes to timing, which in investing is practically everything.
While knowledge and skill can overcome luck, as I also indicated, without access to the kind of platform you have created, I am dependent on my luck.
I'm better off staying out.
Thanks again for your extensive and informative consideration!
BTW, another reason it looks more cluttered is because I was showing a lot of data. Here's a 5m chart with a bit more zoom on it. Also notice the dramatic increase in volatility that began expressing itself as the previous upmove came to an end (lots of wide spreads, low directional liquidity, etc)...
There is indeed a lot of data, all of which is unlabeled. Since I don't know which particular plot represents which particular dataset, it is difficult to know which plot represents volatility, for example.
From your statement that volatility increased as the move upwards was ending, I am guessing the the disconnected blue lines above and below the main body of plots represent volatility?
What is the m in '5m'? It seems not to be months, or minutes..
Anyway, I strongly agree that with your platform I would be far less likely to throw away my hard earned SBD on foolish trades. Since I do not possess your superb tool to analyze investments, I am probably better off not making trades.
Interesting note: The day I first invested in equities, was the day the dot.com bubble burst. I lost almost 1/3 of the value of my investment that day, as I had told my broker to put it all in the raging tech equities that had been performing so well.
Over the next two weeks, my broker (morgan stanley) continually assured me that all was well. Finally, exasperated, I told them to sell everything NOW, and put it all in MEOH, which had just plunged to $2.50 from over $25.00 on news that California was angry at them.
It was a ten bagger, and by the end of the year, my account was up $80. I consider that both a warning, and a success story. It is a warning, because it tells my my timing is not just unlucky, but maximally unlucky - as my recent sale of SBD confirms. =p
Sorry to hear about your Internet bubble story, but truth be told we all get into those phases. That's why risk management and position size is so critical when trading and investing. But it does sound like you were on the right track with MEOH, so that's something to think about... :)
Regarding the chart, 5m = 5 minute chart, though it only prints if activity actually took place during that 5 minute period (or 1 minute period for a 1m chart, etc). Regarding increase in volatility, I wasn't talking about indicators, simply the underlying price action as shown here:
What you see there are people buying high offers and low bids with not much going off inbetween, until "out of the blue" it tanked. Think of it as a bit of "hot potato". Finally people just gave up, or placed stops just below that range, and when it broke, everyone piles in all at once and chases it all the way down.
Thanks for your helpful explanation. I am surprised at the spreads between the highs and lows. I didn't realize there was a $.10 range in price, otherwise I might have tried to lowball when I bought Steem. Or highball when I sold SBD...
SUPER HELPFUL! Thanks dude
glad you found it helpful @chrissymchavez! :)
Solid post. I was about to start a similair discussion. It's surprising how much uneducated investors the crypto space has. You still see people invest in this shady and scammy coins. I was researching a way to do better investment analysis on the current cryptos. Besides coinmarketcap.com there is: https://www.coincheckup.com I'm really enthusiastic about this site, they let you analyze every single coin out there. Check: https://www.coincheckup.com/coins/Steem#analysis To see the: Steem Report
Hi! I am still new and learning about Steem and SBD. I read in the post that you are "throwing money away" when it's at a premium and noticed that your article is from 9 months ago and that the prices have changed. Your post shows .30 and my screen says 1.14 today. Does that mean its even more advantageous to do it now through the market, or the other way around?
Also I want to make a bigger purchase with USD. Do you have any suggestions for me?
Thank you!!!
If you're trying to purchase with FIAT, your best bet is to be patient and wait for a bit of a sell-off in STEEM, shop around the various exchanges, and see where you can find the best "bang for your buck". You really don't need to worry about SBD at that point.
SBD is usually acquired on 50/50 post payouts. And when you receive SBD, you definitely don't want to use the "conversion" feature while it's trading for over $1 USD. However, I don't think it's really that much of an issue anymore anyway, as STEEMIT has actually removed that feature from the platform (at least for the time being).
Thanks for sharing. I just notice about this as I used to convert it
@doraemon526joice for your infor :) in future~~