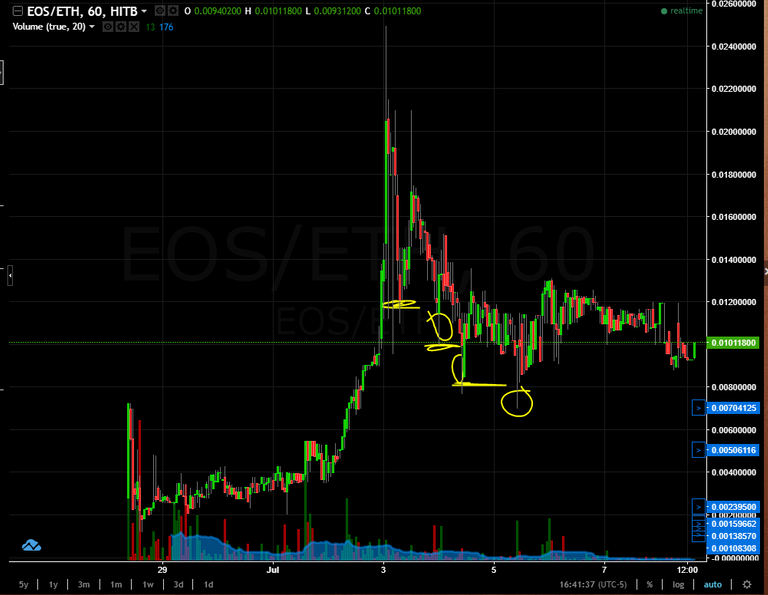
I've added an image to clarify. The white bar is the base I identified, which had a nice bounce upward, and the red arrow is the slow drop below this base which I wasn't sure counted as a buy area. I eventually ended up making a nice trade by buying at 2.05 and selling at 2.39 but I'd like to know if my thought process is valid. Thanks!
I was referring to the EOS/USD chart which was slowly going down for the past two days or so on the 1h chart. It eventually bounced up when reaching $2, would you have taken a trade there by your method or is it focused on panic flash crashes?