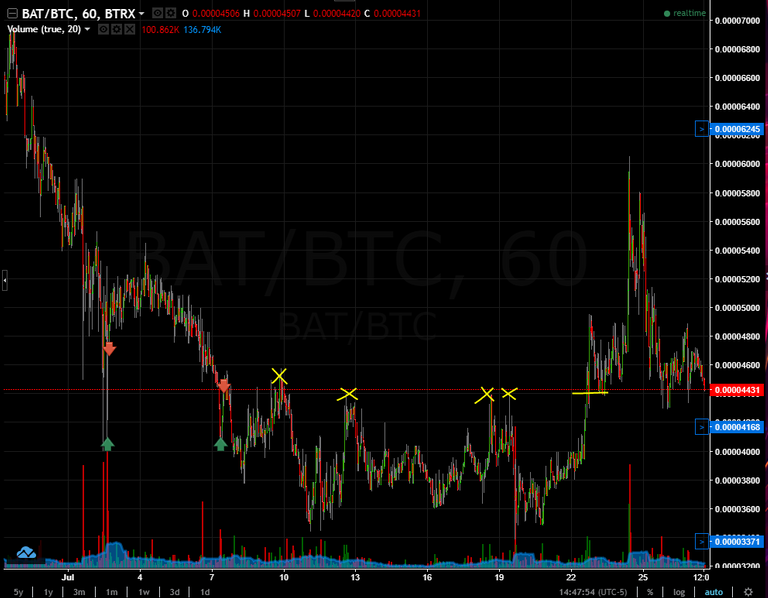
I dont want to confuse anyone with all the Xs on this chart but lets talk about crowd mentality for a second. So 44s were resistance quite a few times, shown by the Xs and then when it finally broke threw it jumped up to 49s, then a sharp pullback to 44s again to see if that was going to hold as support, or in our language, was there a base forming at 44s.. then you get this huge spike to 60, and after all the craziness is over it starts to work its way back to the base and retest it a bunch of times.. bearly breaking it.. So the question is this: From July 22nd to the 27th is there lots of traders trapped above 44? Yes.. Will there be a panic when 44s finally break? Would all those trapped traders start to feel the pain and bail? .. You see, clearly there is good reason for a panic to develop here, and thats exactly what were looking for.. so I would be ready to buy up the 38s 37s 36s and so on, if we get some quick red bar movement down..
Drawing bases and safe circles are nice and easy, but simplistic if you dont understand the real reason for them.. You have to read the story of the chart and get why its acting the way it is. Once you have the story clear in your head of what everyone was thinking and how they could get hurt by a surprise, then you can take your trade with confidence when you see that panic develop.
You are viewing a single comment's thread from:
That explanation makes sense. I would love to see more walk-throughs of chart narratives like that. It's really helpful in learning to see what's really going on behind the ups and downs. Thank you!!
that's a great answer, I'm really starting to get this whole "story of the graph" thing. Thanks
Your post is pure GOLD.
YES! The story of the graph is very helpful when you're the chart doesn't match exactly what we see in the videos. I would love to see more of this kind of narrative walk through.
This post just turned on the lightbulb! That is the "story of the chart". Thanks for all you do, Luc!