You must have come across the word 'Data Science' and you might have wondered what that means. Why are there so many articles on this topic? I must admit I was a victim of online advertising as well and I started listening to the courses online and learning from home. However, having discovered so many resources on this topic, I regreted many times. No matter what, I decided to share with other people some very useful but simple tricks.

Getting back to the topic. So, what on this earth is adata science? There are many definitions, none of them covers all, since nowdays technology is developing so quickly, but the simpliest one would be - mix of statistics and programming. The most powerful programming languages for doing Data Science are R and Python. Both are open source languages that you can download free and these tools provides many useful packages.
There are many things you could do with these tools, from simple Exploratory Analysis to making medical diagnosis and image recognition. However, in every analysis, you will always have do these steps - importing data into your working environment, cleaning data, doing some basic statistical analysis and visualization.
In order to show you how we can discover interesting information from relatively huge data set, I am going to show you step by step how you can write it by yourself. Discovering some useful quick insights is also part of Exploratory Analysis – step that always have to be done.
Firstly you have to have installed R. Besides R, R Studio - Integrated development environment for R is highly recommended to have, since it offers much more possibilities. You can go to CRAN website and simple download depending on the operating system you are using. If you are on Windows go to 'Download R for Windows', 'install R for the first time' and then simply go on 'Download R 3.5.0 for Windows'. This version for Windows will work with both processors - 32-bit or 64-bit.

Installation is very simple as well. Just confirm all default settings. After you download R, go to R Stduio website and simple download free version, clicking on this link https://www.rstudio.com/products/rstudio/download/#download. Same, just leave checked default settings. Now you have all equipment.
When you open R Studio it looks like this:
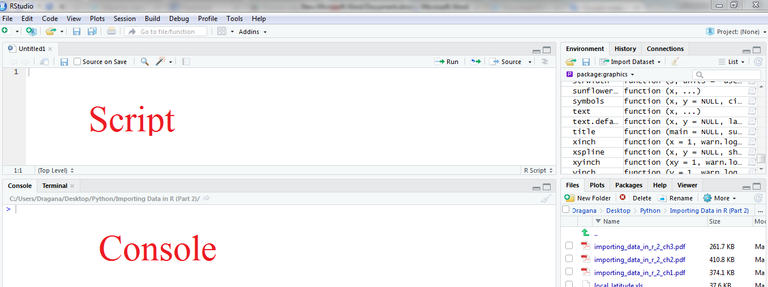
We will write our code in Script, and run it with command CTRL+Enter.
Although many teacher start with so called base R, which also offers very much possibilities, I would recommend starting using packages right away. I know this does not sound very appealing to you, but learning one alphabet is enough, so why not learn one that is mostly used.
The package I recommend is dplyr package, the part of tidyverse package. All of these are developed (and still in development) by Australian statistian Hadley Wickam, one of the biggest contributor to R development ever.
So let’s begin. First we will install packages and load them into session.
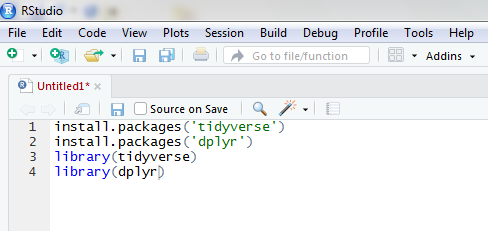
Select all this line and click CTRL+Enter. Now we have very powerful tool to manipulate with.
I mentioned a dataset. Luckily if we are not able to find any we can use one that comes in a package with base R. Here, we will be using hflights dataset which we can load like below.
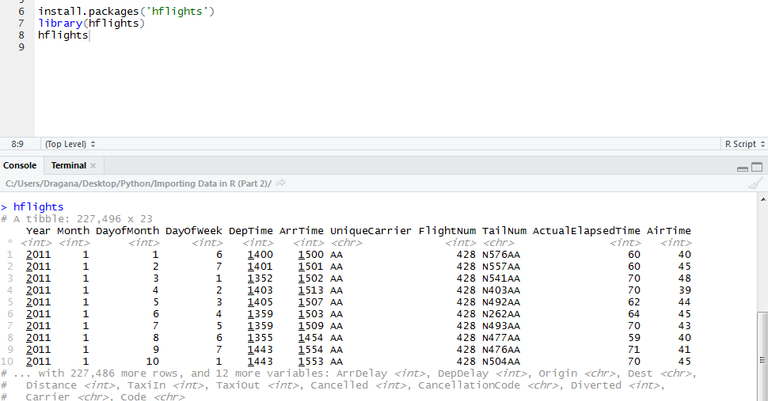
When we executed commands dataset poped up in the console. This format of representig the data is slightly different from typical data frame from base R and is called tibble. Here we see that it has 227,496 rows and 23 columns. If we type ?hflights we see that it contains all flights departing from Houston airports IAH and HOU. So, I can hear you asking me what can we do with all these numbers. Answer is - so many things. Basically every analysis actually include digging through row and columns and discovering some potentially useful insights.
If the column Unique Carrier represents abbreviation for carrier suh as SouthWest, JetBlue etc., and column Dest the destionation (which is not shown here, because it couldn’t fit) we can ask ourselves 'What is the most visited destination for each carrier?'
Dplyr package comes here in handy. So, let’s get started.
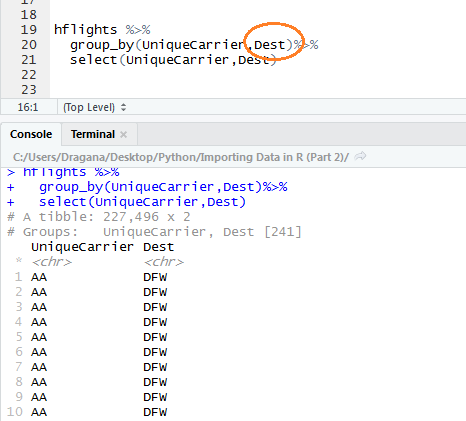
First we take a data frame hflights and then using pipe operator (%>%) connect with group_by () function that groups values in a column in a distinct subgroups. We want it to be grouped according to distinct carrier types. Since all others columns makes thing more confusing we can select only column that we need with the function select().
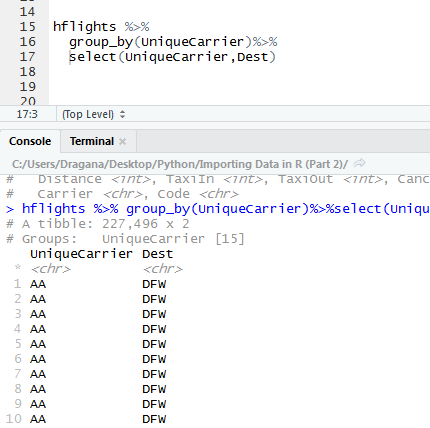
When we group one column, second column that we are interested in will be unsorted. So why not group second as well, so that values in second column have alphabetical order also. We can do this in the same call with first grouping.
Although it is not shown here, these two column are grouped indeed. Next we want to calculate how many times AA carrier (short for American Airlines) flew to DFW destination as well as other ones. We could do this with summarize function, which takes our tibble and add new column calculating the value we want.
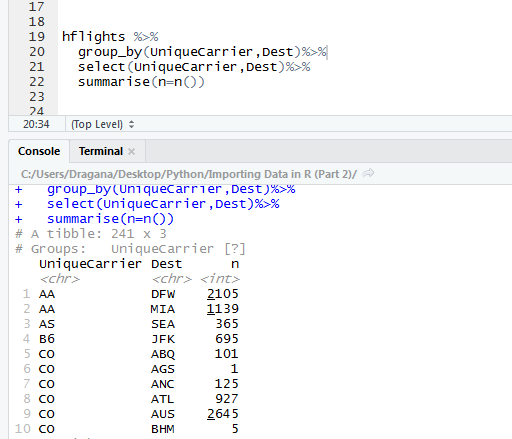
Here we see that American Airlines flew 2105 times to Dallas Airport, and 1139 times to Miami International Airport. But still how can we find out what is the most visited destination for each carrier? We just need to run few more functions.
Mutate() function works similar thing to summarize function. It adds a new column. Here we want to add ranks, so that the most visited places have 1 and less visited numbers that are below. Can you spot a new column?
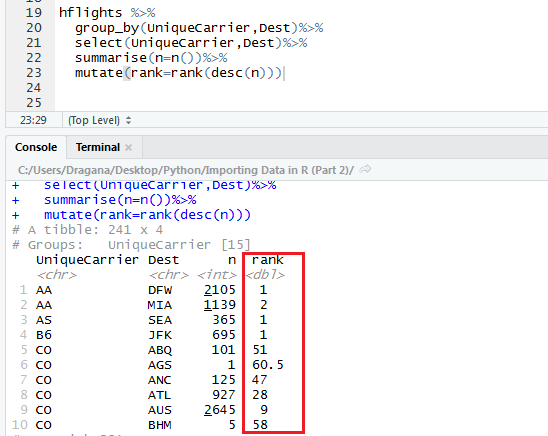
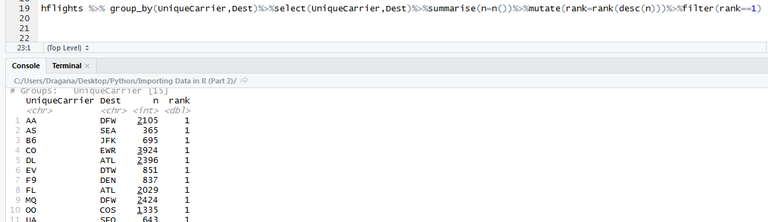
Don’t get you terrified so many brackets in one line. We just had to consider descending order since rank function adds number one to the smallest value and ranks in that order. After finished ranking we figure out we are just interested in the biggest values, i.e., numbers one. So, how can we filter only these values? The answer is – very simple, with filter() function. Since we are only interested in ranks with number one, we set rank with '==' sign to 1.
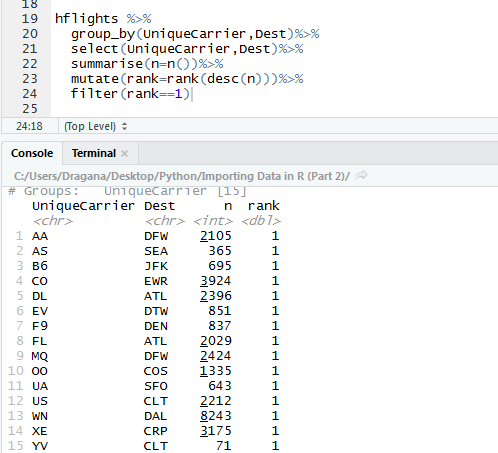
And we are there. We see that the most visited destination of American Airlines is Dalas Airpot, of Atlantic South West that is Seattle–Tacoma International Airport in Washington etc. We could have fixed abbreviations earlier so that only full names are shown, but this require a bit more of code.
Also we could have written this code in one line, making dplyr package so powerful and concise.
I just want to highlight word code, because you can reuse it so many times, changing only variable, but leaving everything else that do the thing. So you could have used another dataset with its own name (just like here was hflights), and another columns from that new dataset. Therefore you can literally copy-paste the code when doing similar analysis. If this seems to you a bit slow then you can write a function which would apply all this on different dataset, making your job so clean and easy, with runing only few lines of code instead of manually copying and pasting or in the worst case writing again every time when you start with a new dataset.
I hope these words give you a glimpse at how you can extract some useful information from many values in the table. Also if you find this interesting, that means you consider data science interesting, which although it is a very wide topic, if you start learning basic blocks and then combinining these you can solve many namely complicated tasks relatively easy.
See you soon!