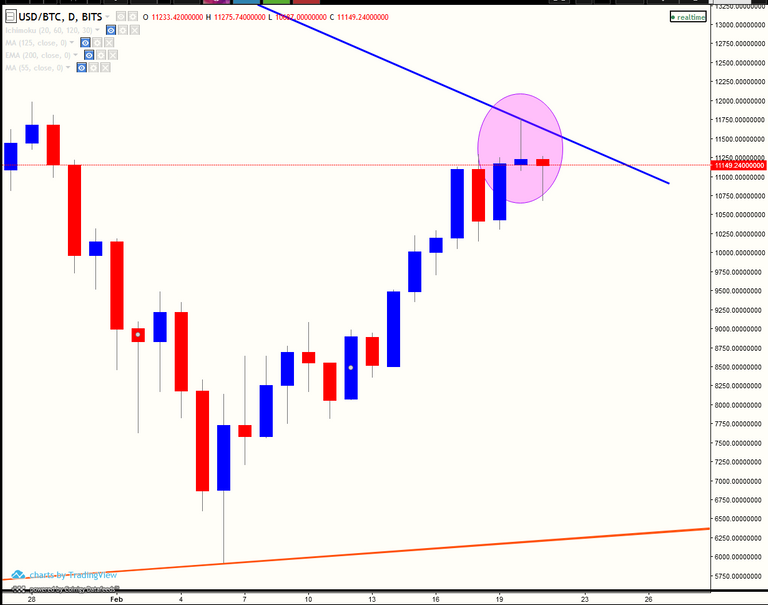
Guys bitcoin has formed a doji at the resisting trendline. Doji always indicated a reversal. Short trend of btc has been bullish. I mention again short trend and by short trend I mean 4-5 days. Now a reversal must come.
It is difficult to break 12k zone. Reasons are given below.
Current Trend:
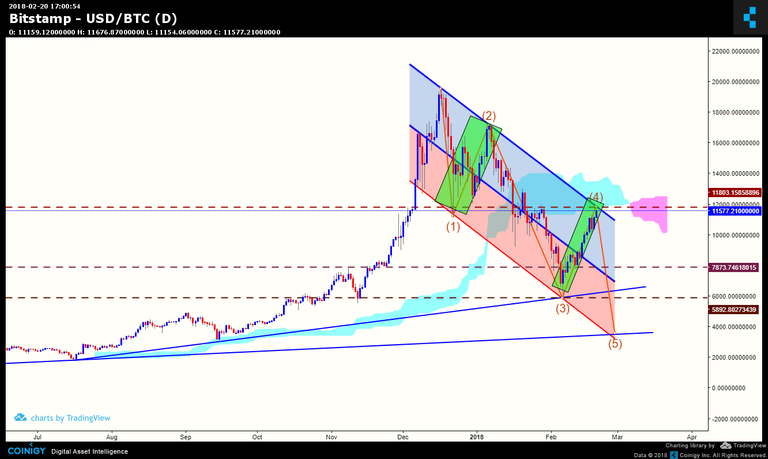
I have been seeing lots of posts about bitcoin that bitcoin is bullish. No seriously its wrong. The trend is still bearish. TO be bullish we need to break the cloud resistance at 13.2k. Thats the point when we will go bullish. Currently we are in the downtrend and what happens in downtrend is that we keep on making lower lows. And next lower low will be around 3800-4200 dollars. SO thats the current trend of bitcoin. Which is bearish!
Descending Channel:
Bitcoin is moving in a descending channel. It is moving smoothly in channel. THe channel has been shaded in the chart with two rectangles coloured red and blue. Bitcoin has tested the upper line of this channel two times and also the bottom line two times. I am expecting bitcoin to test the lines once more. It will test the upper line again which is 12k. Break of this channel is difficult at this moment where there is dull volume. We need huge volume to break this upper line and the resistance of 12k. So after this test we will have a pullback to the lower line of this channel at $3800-4200.
Strong Resistances:
In the previous paragraph I told about the resistance zone of 12k. THe reason that it cant break is first the volume and the second is the strong resistance. WE dont have any single resistance there. We have a trendline resistance there, horizontal resistance, cloud resistance and we also had an inverted HnS pattern and the target after its break was the length of the pole according to this pole the target is also again at 12k region. So thats about strong resistance.
Elliot Wave Analysis:
We are currently in the 4th impulsive wave which will continue till 12k at the upper line of the channel. After the test at 12k 5th wave gonna start which will continue till 3800 dollars. Thats the wave which gonna hit traders too much.
Ichimoku cloud Crossover:
Just have a look at the chart. You will see a cloud having two colours aqua and pink. Aqua indicates the bullish bias while pink indicates the bearish bias. The cloud gave its crossover a few days back. The bias turned bearish. Which indicates we gonna go much down again. Combining crossover with the above analysis I think its gonna come down now around 3800 zone.
Time frame:
I am not saying it will come down just tomorrow. Its gonna come slowly. Having small pullbacks at every support. It will take around 15-20 days to come down to the ultimate bottom zone.
So that was all from the analysis. Its just my view. Do your own research. and follow at your own risk. For any querries use the comment section.
If you liked the post donr forget to:

You repeat your view about Bitcoin be bearish and I repeat that your stand is technically sound! But In long term predictions a sentiment among people involved in trading and talking about some asset can impact the price movement.
I firmly stand on opinion that charts produce news and news machine sometimes distort the facts on charts and miss lead the people. Than in turn people in smaller or bigger extend impact the price moves.
If overall sentiment saying, that is time to some bull action, this action will pop out and impact the price. If we look on fundamental analysis as interaction between actors trading and laws of price movement this can be sometimes the right path. But I stand on opinion that the laws of price movement is stronger then the sentiment and fundamental analysis.