
BTCUSD - Day Traders Chart Setup
Moving averages:
Green = 50dma
Red = 200dma
Orange = 9ema
Black = 20ema
Typically I have been presenting a swing traders chart setup to steemit users and providing possible setups. Today we are going to analyze the day traders chart set up, this chart is typical for tracking shorter term moves. The reason i normally use a time adjusted chart for cryptos is to essentially smooth the curve and hopefully provide safer trade ideas.
Bitcoin after reaching 7500 has given it all back and failed to reclaim the daily pivot R1 going on 72 hours now. This chart setup itself is showing a longer term bearish reversal in the works. The purpose of sharing this analysis today is because of the extreme volatility we have observed in bitcoins price swings - I personally cannot wait for a volatility index on bitcoin to play, but I digress...
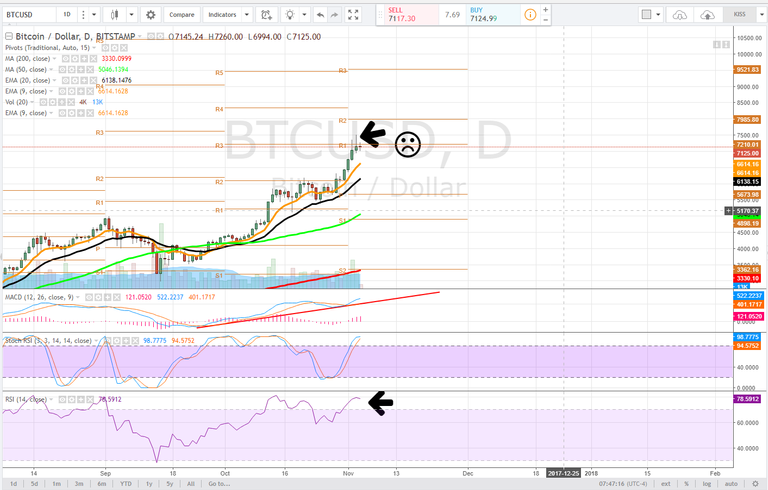
Daily
On the daily time frame, we have observed a series of lower highs and lower lows going on the 3rd day here. In order for bitcoin to remain bullish traders and investors need to see the price back above pivot R1approximately $7210. and reconfirm this level as support - consolidate on it.
The stochastic RSI on this timeframe has extended upwards driving the RSI once again into extreme overbought territory. The MACD has been trending upwards and is historically extended above the zero line. Falling below the clear trendline would confirm a bearish reversal in momentum. It is still important to recognize that nothing goes straight up forever, and price progression is as well a function of price verification. On the daily time frame, we are looking for a test of the 9ema (orange) and if it fails the 20ema (black). The bear case for a correction would target the daily pivot, approximately $5656.
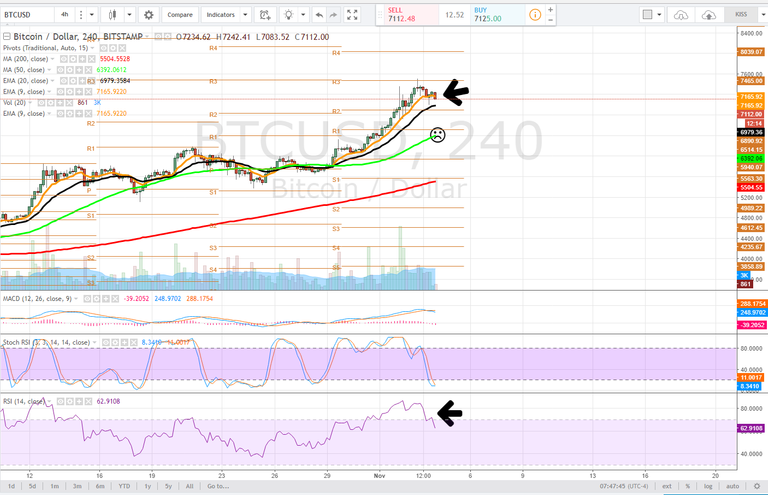
4 hour
The 4 hour time frame is looking a little worse for the wear, as the price is repeatedly failed to reclaim the 9ema (orange) on this time frame. Next target before any kind of real relief pop is the 20ema (black) approximately $6979.
The Stochastic RSI has just fallen into downtrend where it is driving the bearish MACD cross, this all suggests in the short term, bullish momentum has waned. If the price cannot maintain PIVOT R2 on this time frame, approximately $6890, we would look for a test of the 50dma (green) and pivot r1, approximately $6514 where it appears the 50dma will converge.
Very bearish would be the 9ema falling below the 20ema.
The RSI has also begun a sharp drop from its extreme overbought conditions and may begin to trend lower on the 4 hour as it has in the 1 hour time frame.
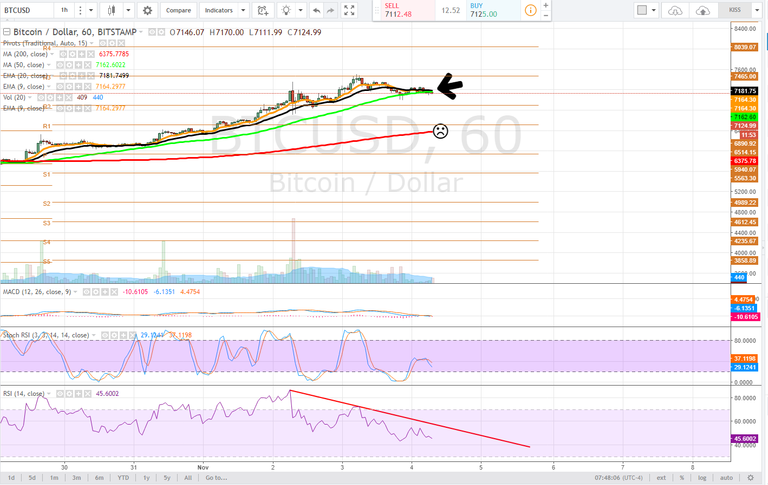
1 hour
On the 1 hour time frame a bearish convergence of the shorter period moving averages to the longer period moving averages has occurred as it appears the 9ema and 20ema are moments away from falling below the 50dma. This is how traders use moving averages to determine potential trend shifts.
As this bearish moving average convergence occurs expect some light volatility and a possible bull trap which could give way to a test of pivot R2 on the 1 hour, $6890. It is essential for bulls to hold these levels as if the price cannot maintain and begins to set a series of lower lows a test of the 200dma (red - $6375) is very likely.
On the 1 hour a down trending RSI is very obvious and coincides with the bearish moving average convergence, with the stochastic RSI barely able to push higher before it ultimately reverses into a bearish cross. The MACD on this time frame is quite lame as the bulls are just not showing up to the party which is typical to observe, again when the moving averages begin to make bearish convergence.
It is important to recognize that moving averages are a backward-looking indicator as they are dependent on historical data, but that doesn't mean they cannot be used to reliably determine areas of support and resistance.
Bullish Above: $7220
Bearish Below: $7080
RISK TRADE: Scale into a short position, if using leverage, cautiously do so as shorting is still quite risky. We are at what is known as a point of inflection
Don't forget to use stop losses!!!
Previous Articles:
BCHUSD
ZECUSD
LTCUSD
BTCUSD
ETHUSD
BTCUSD
LTCUSD
XMRUSD
Follow at your own risk, Not a financial adviser, understand the risks associated with trading and investing. Manage your own Risk - in other words you could lose it all and it's your own fault.

Very good analysis, clear and precise. It could almost be a lesson on how to do technical research.
Thankyou.
That is part of my goal with these articles. Feel free to ask questions ill try to answer of course!
Great I will be following you, because I know you will improve my education.
@stevuk i am totally agree with you.but some times staistics show wrong in future.
Correct they do, I think you should read the technical information above, and use it as a guide.
You should then check the fundamentals, such as the latest bitcoin news, whats happening around the world, and of course the upcoming bitcoin fork.
Once you have done the above, you should then make your own decision on what to do, buy, sell, or stand aside.
well suggestion...i will follow you also.
exactly as @steveuk put it - im definitely not always right, but I am a technical trader, but to rely on my analysis wholly would be silly. The intent is to provide some insight, guidance on technical formation and allow hopefully help individuals to learn how to read charts. Nothing is ever certain - but statistics are math and this is why technical analysis is a tool that is more than a century old.
then well.please keep me teaching about that statistics which have been you done.i will be glad to listen you.@satchmo
Speaking of derivatives for BTC....Can you imagine if they create leveraged Bitcoin ETF's like they have for natgas, oil, and any commodity imaginable? Good lord it would be volatile. A day traders dream... and if they had an inverse ETF one could do an arbitrage play by shorting both the long and the short fund, hold the position for a few months and profit from the decay.
An example of this type of trade would be shorting both UGAZ and DGAZ simultaneously (3x leveraged natgas etfs) for a period of a few months and profiting from the net decay of the sum of the prices, which always trends downward over time. I've not tried this strategy because I've not found a broker that offers shares of DGAZ to borrow (I've heard Fidelity has them sometimes). I know one person who's done it and he's made a lot of money in the process. I have made money shorting just UGAZ before when futures contract spreads are high but I had to constantly monitor the price because of the volatile nature of it (price spikes out of nowhere = squeeeeeeze!).I don't mess with that anymore because I don't have time or the nerve for it now.
Regarding bitcoin (back on topic lol), I can't decide whether to lighten my position a bit and take some profits from earlier buys from some weeks ago or hold all of it thru the fork later in the month. Those long upper wicks on many of the recent candles are evidence enough for me that BTC needs to stop and catch its breath before heading higher. I'm curious what will happen to the price after the fork. I suspect we'll see a nice pullback and it could be a good short opportunity for short term traders.
Nice charts, as always. Have a good weekend.
I personally am trading bitcoin to accumulate more bitcoin as the FOMO is not over yet - but in the immediate term my read of the chart is a downtrend.
I would absolutely love the ability to have a leveraged ETP on btc -- especially if options become available for it. That would be absolutely insane!
I tend to short volatility etf VXX, or take a long in XIV every pop, nothing decays worse than volatility futures in capital markets!
But absolutely you could, provided you have the capital to never get a margin call perpetually hold leveraged ETPs short to capitalize on price decay. Energy is best for this. Gold is another option but with the fed cycle the trade is more complex. SPXS is another good one to short.
I got into XIV when it was $16 a couple of winters ago and sold at $22. I think it’s trading around $80 right now? Makes me want to kick myself. It’s a good one. It benefits from contract rollover decay of its inverse like 90% of the time. When VIX is in Contango XIV is a winner.
the XIV parabolic move is an anomaly - this is the lowest historical volatility in the stock market since 07 - difference now is that in 2014 the index became completely derived from options bets on the S&P mini futures - so its hard to say if thats part of why this run is occurring ... but as you know 1 decent spike in volatility can wreck XIV.
Yes it is a bit of an anomaly and I think the markets are somewhat rigged and have been for the past several years at least...rigged in favor of the bull. My trading experience is less than a decade old so the current environment is the only one I've ever really known. I've met a lot of people on ihub (used to hang out there a lot, not so much anymore) who have been around a long time saying that it didn't used to be like this--things used to be easier to predict and market moves made a bit more sense than they do now. I think some of it has to do with algos but I also think the govt has had a hand in it as well.
Lately it seems like the market just has to close to the upside no matter what, meanwhile we have things like netflix with a PE of 300 -- 300 years to double your money. Something has to give.
further, on the flipside, when nixon was president as soon as any inkling of an impeachment motion hit, stocks entered a 1 year bear market -- perhaps we may observe something similar, all things considered.
img credz: pixabay.com
Nice, you got a 2.0% @minnowbooster upgoat, thanks to @satchmo
Want a boost? Minnowbooster's got your back!
The @OriginalWorks bot has determined this post by @satchmo to be original material and upvoted(1.5%) it!
To call @OriginalWorks, simply reply to any post with @originalworks or !originalworks in your message!
Hey, I know it is low volume, but could you do that to Steem and digest it for us? :D :D :D
I did actually not to long ago, was expecting a large move to the upside but then we had all of this funny business with the network, inability to post etc. I will have a look in a few days time ;)
Yeah, thanks! That would be really cool!
It was fun reading your analysis. Very surprising was the rise in price happening all within a single day !
A little surprising for me too, as I clearly had a short bias, but that is why we must use stop losses when we are day trading and swing trading.
Useful analyse... do you think that Bitcoin will reach the 10 000 dollars before the end of the year
Hard for me to say, I expect it next year to be honest. Probably will see BTC correct and close the year just shy of 10k.... probably, but its crypto so who knows - i play shorter periods.
Do you recommend a site that has a good crisp understanding of technical analysis? I have some knowledge of tech analysis but in following your daily posts I realize that I need to have a greater knowledge of tech analysis in order to more fully understand your analysis.
I find that using investopedia to learn terminology is very helpful, especially in learning about candlesticks and chart patterns, i see many not great ones lol
Thanks for this! Interesting developments these days :) voted and followed!
Upvoted and RESTEEMED :)
Thanks Stanley!
Do you think that after the fork of btc we will have a fall? Or in other words, when you see the best time to buy btc?
Fork is a ways away and we are observing a possible trenshift, appears more likely trend down into/towards the fork. A little tree-shake.
I keep the question for when we are closer to the fork. Anyway, I am increasingly convinced that I have to buy more btc ..
Investment Scale approach then would do you well, investors take positions in tranches where traders go full scale in and out.
nice my new friends, you upvote me,