Sometimes we feel life is too complicated and we search for something that makes it simple, makes it simple to understand and make our life easier.

As our lives gets complicated around us ,we tend to search for some shortcuts to go around a obstacle in our life at that point of time. And the results might turn to be good or something totally unexpected. Wish life came with an user manual , so that we have a better understanding of life and the way things work.
Hello friends , so I recently stumbled upon this guy from theworld wide web , his name is Matt Shirley . Matt can make something very complicated look simple. He draws graph about everyday life situations that could be easily understood even by someone who has just started reading. But Matt's creation have enough insight to be taught in a university level.
Matt is devoted to producing a graph a day and he seem to have lots of ideas. From explaining the closed cycle of adulthood to the pros and cons of the first date location , this guy comes up with some clever graph everyday . Enjoy .
#1. Cycle of adulthood :

#2. First date location :

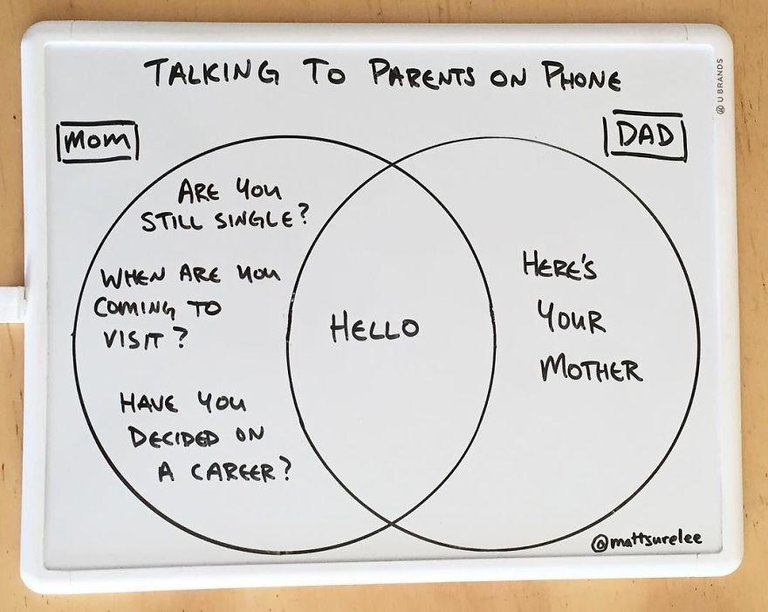
#3. Talking to your parents on the phone :
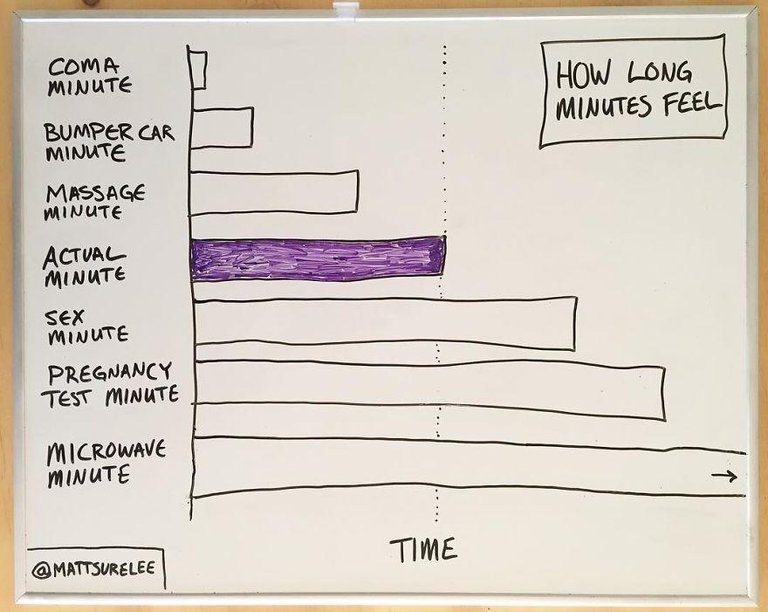
#4. How long a minute feels :
#5. Insult generator :

#6. Sunday nights :

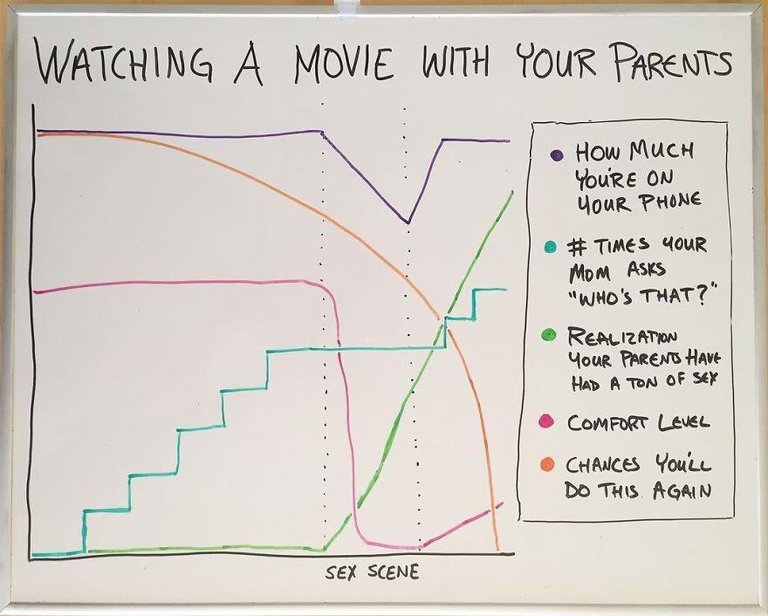
#7. Watching a movie with your parents :
#8. Summer cycles :

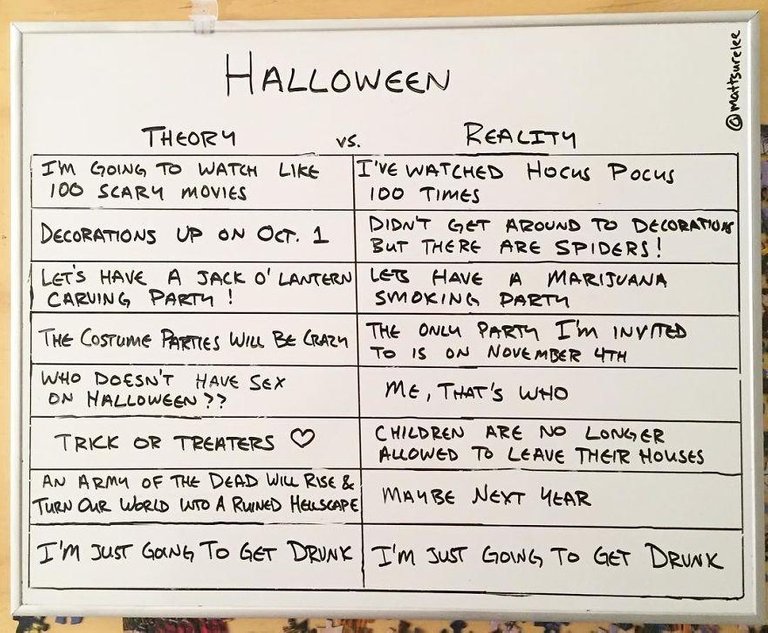
#9. Halloween :
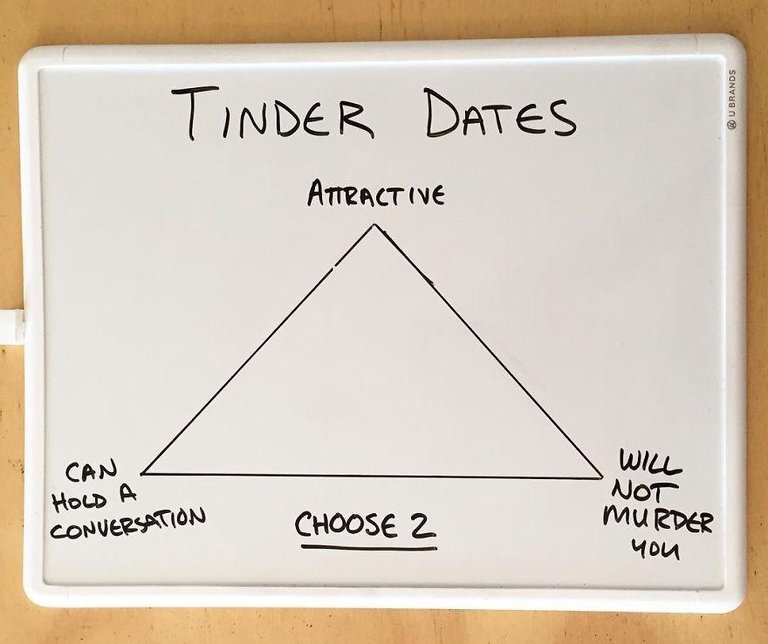
#10. Tinder dates :
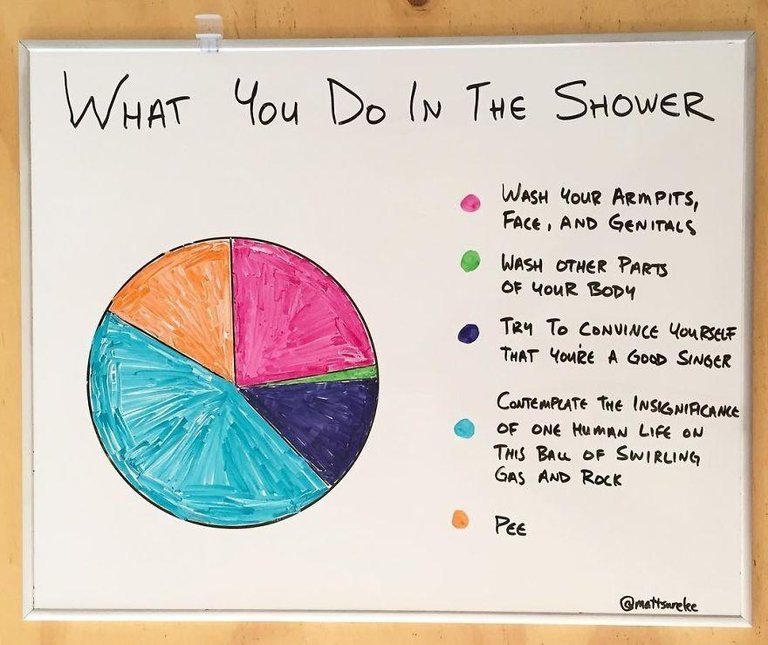
#11. What do you do in the shower:
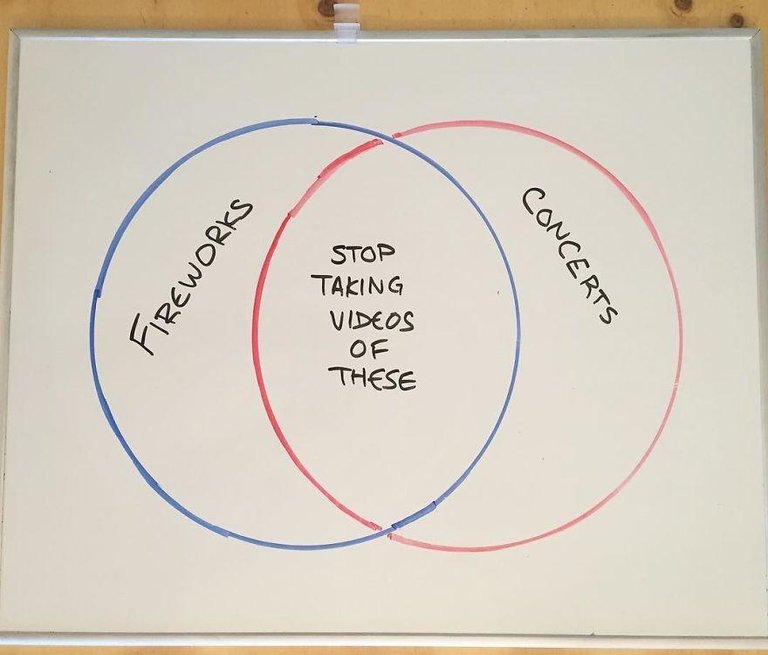
#12. What to capture :
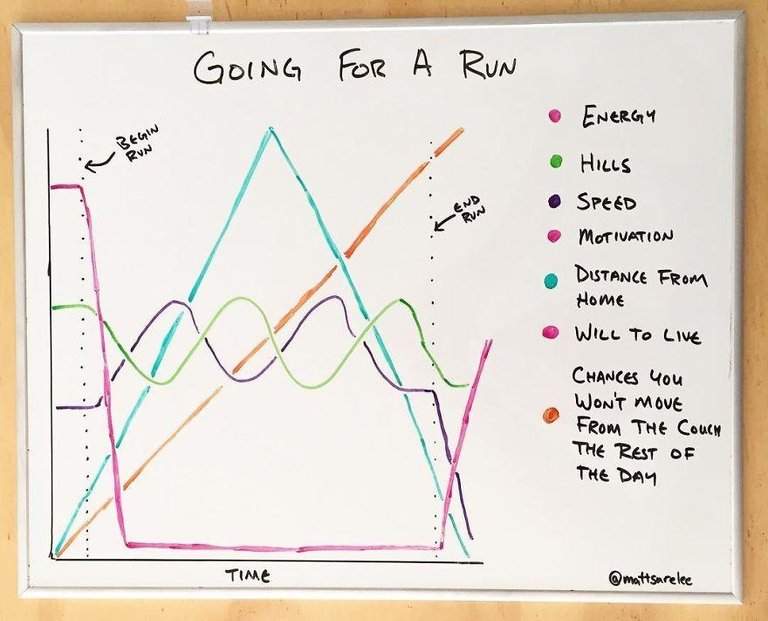
#13. Going for a run :
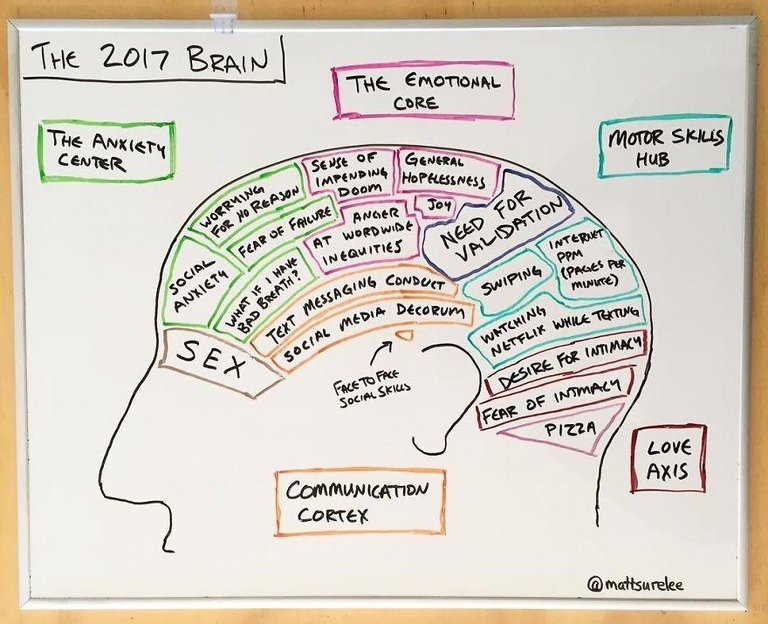
#14. The 2017 brain :
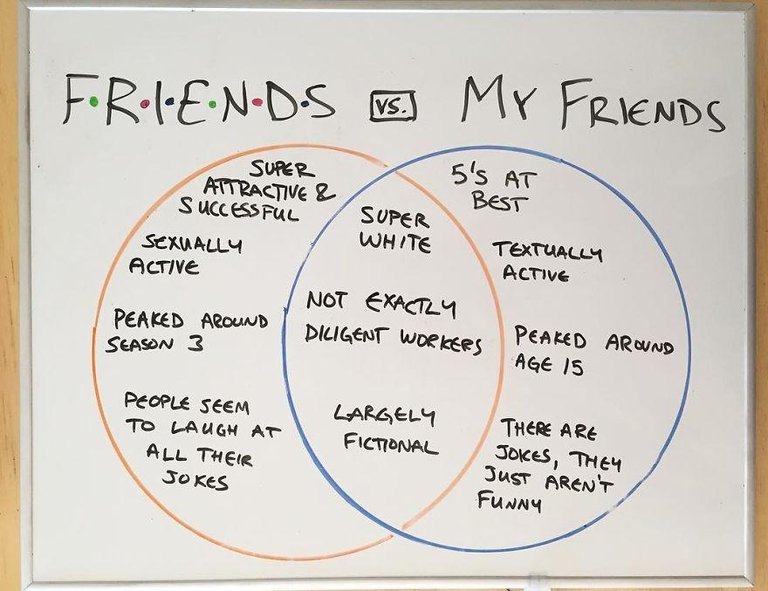
#15. F.R.I.E.N.D.S vs My friends :
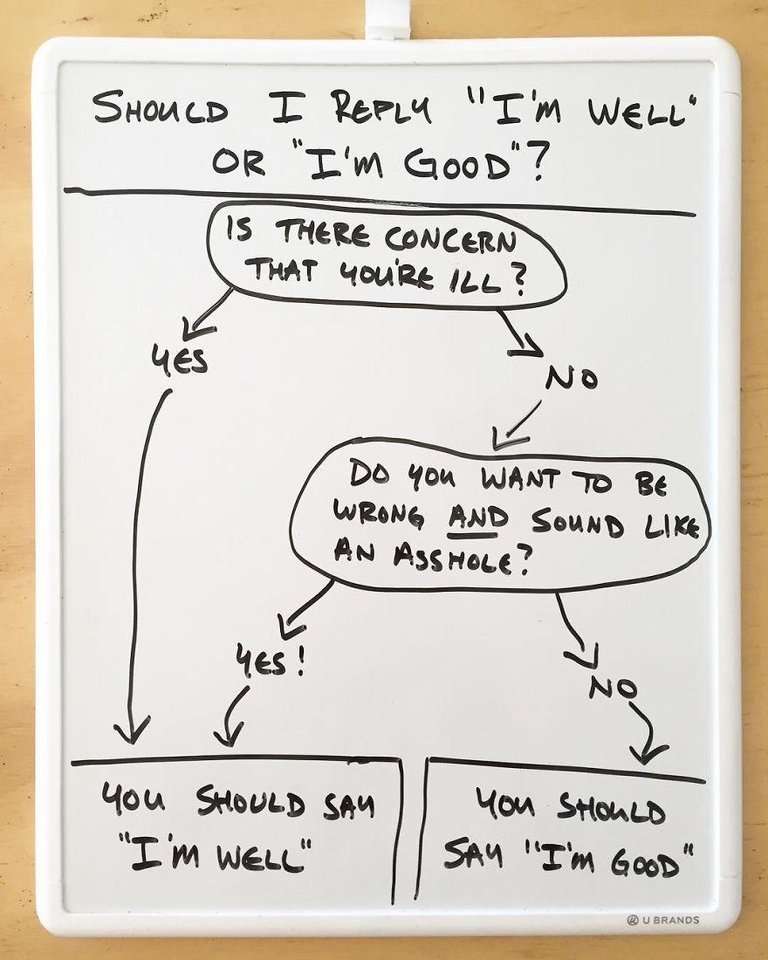
#16. How to reply :
#17. Solar eclipse :

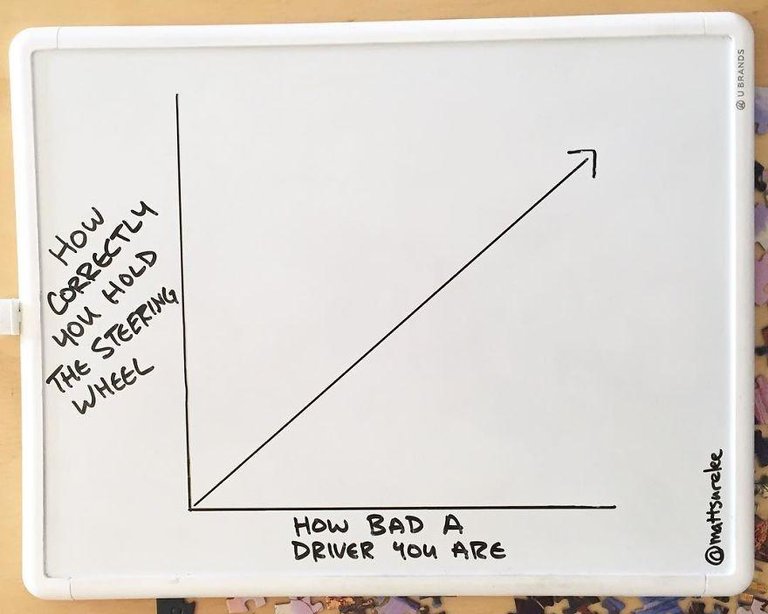
#18. Driving :
#19. Pizza pie chart :

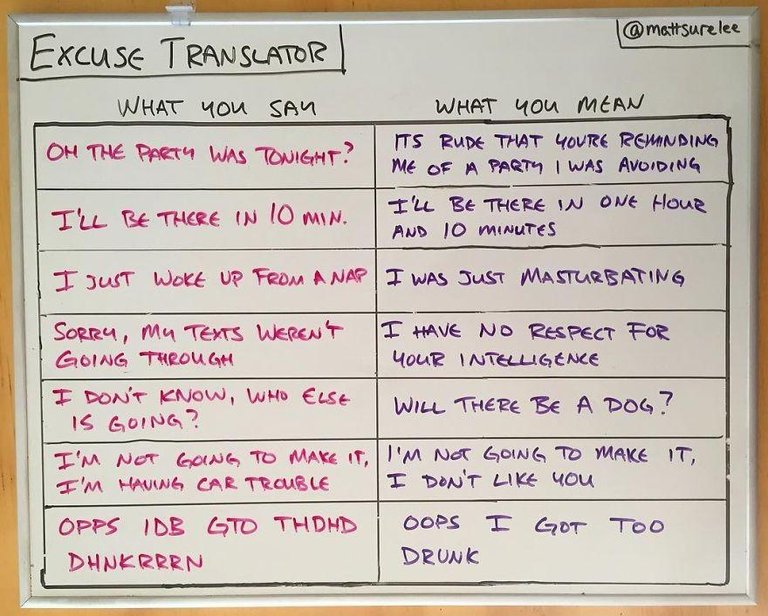
#20. Excuse translator :
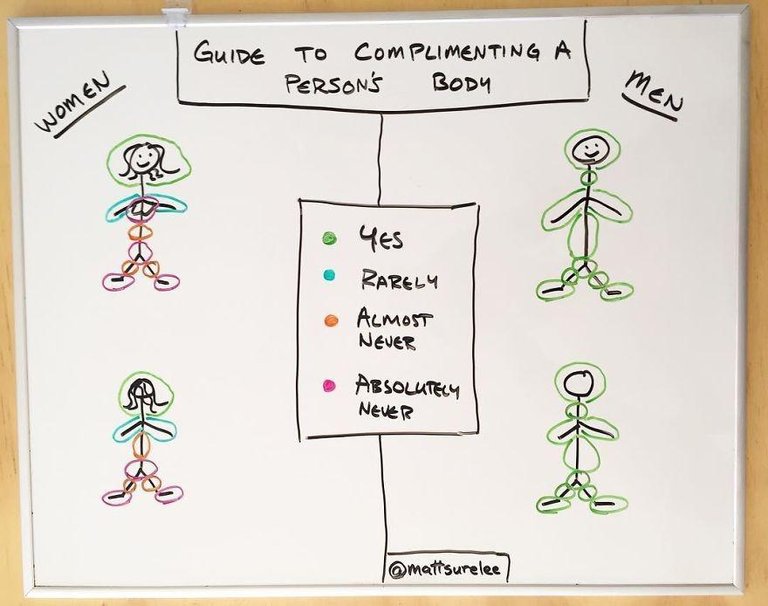
#21. Guide to compliment a persons body :
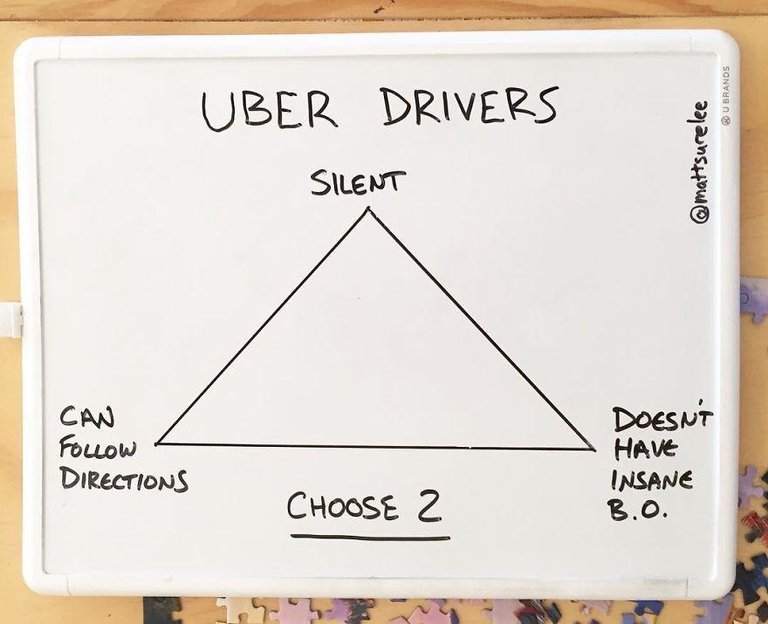
#22. Uber driver :
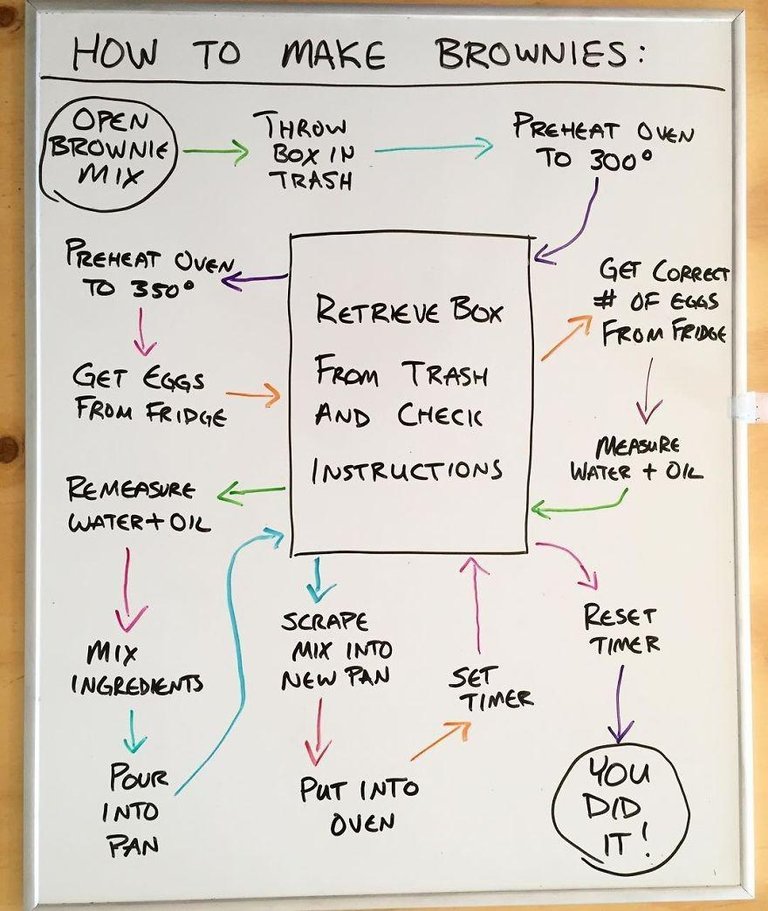
#23. How to make brownies :
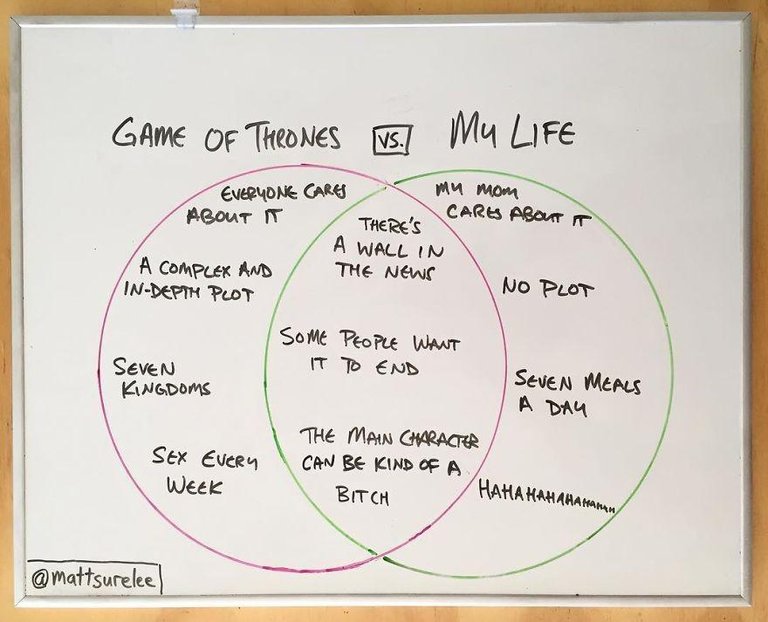
#24. Game of thrones vs my life :
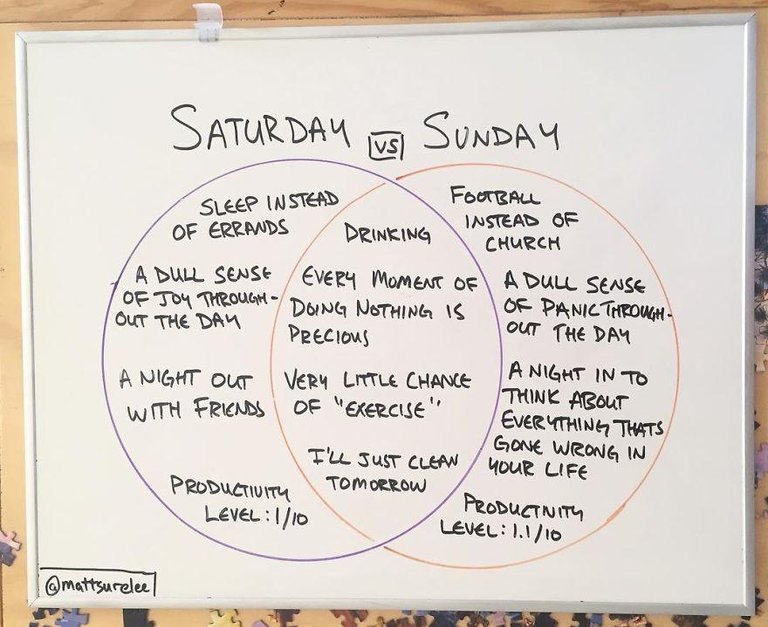
#25. Saturday vs Sunday :
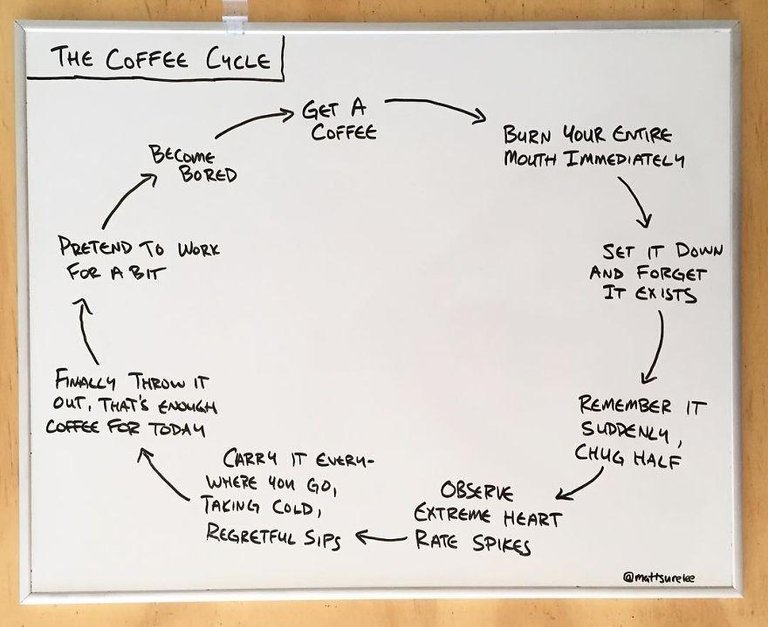
#26. The coffee cycle :
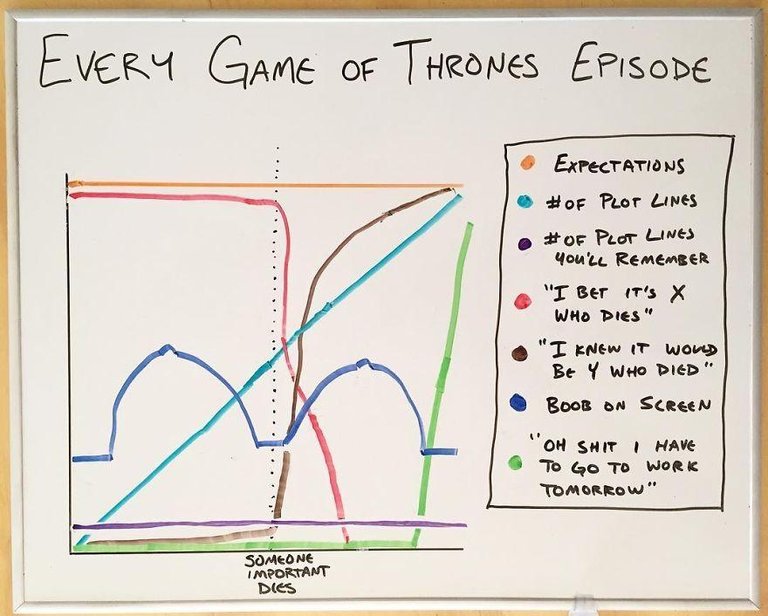
#27. Every game of thrones episode :
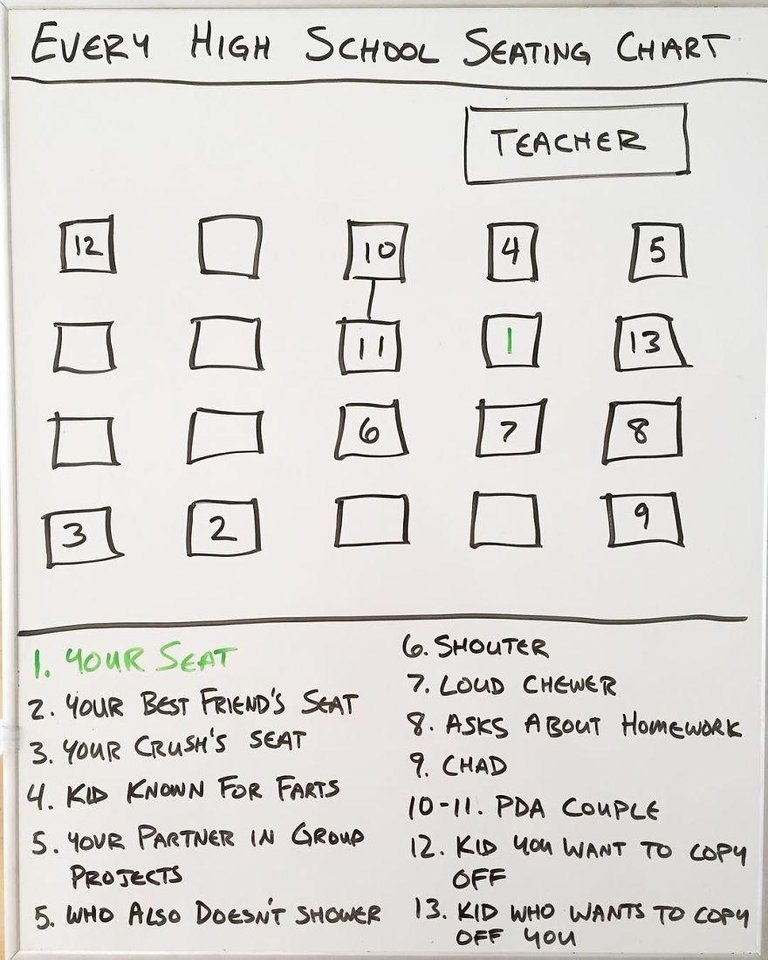
#28. Sitting arrangement :
#29. Car alarms :

#30. Touch my phone :

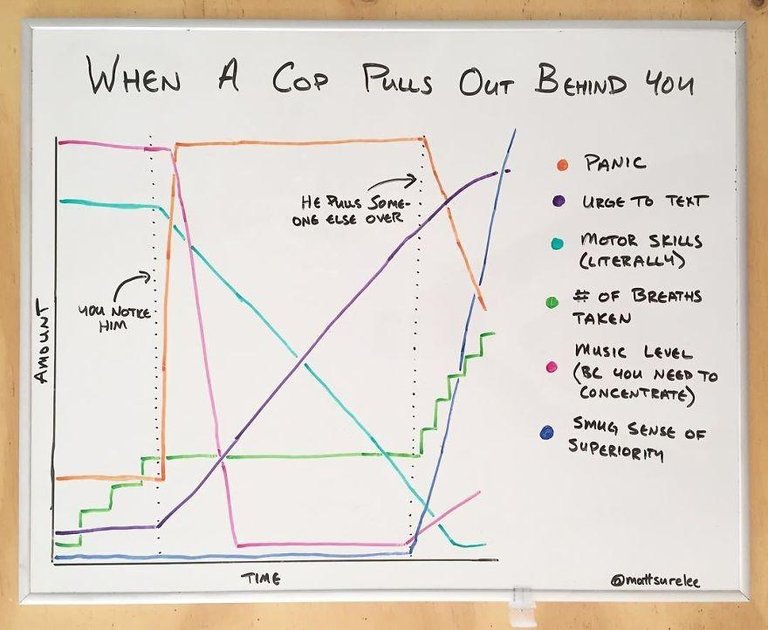
#31. When a cops pulls out behind you :
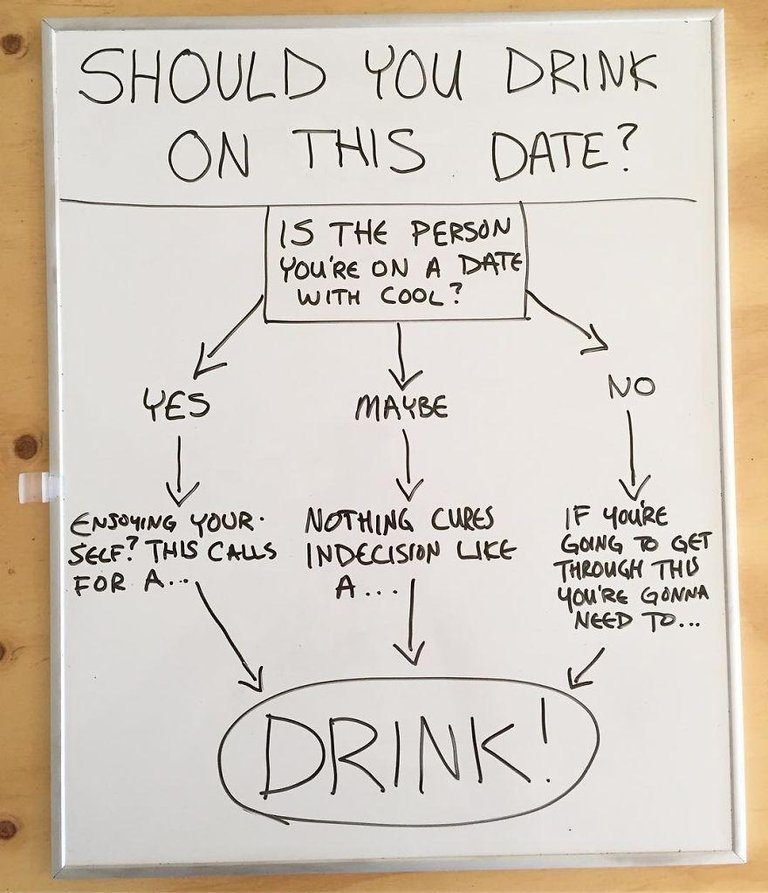
#32. Should you drink ? :
#33. A night out :

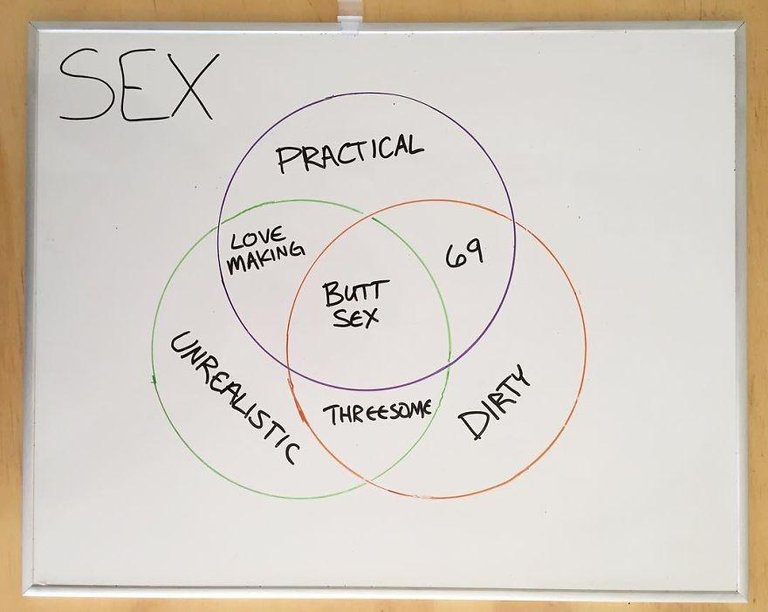
#34. Sex :
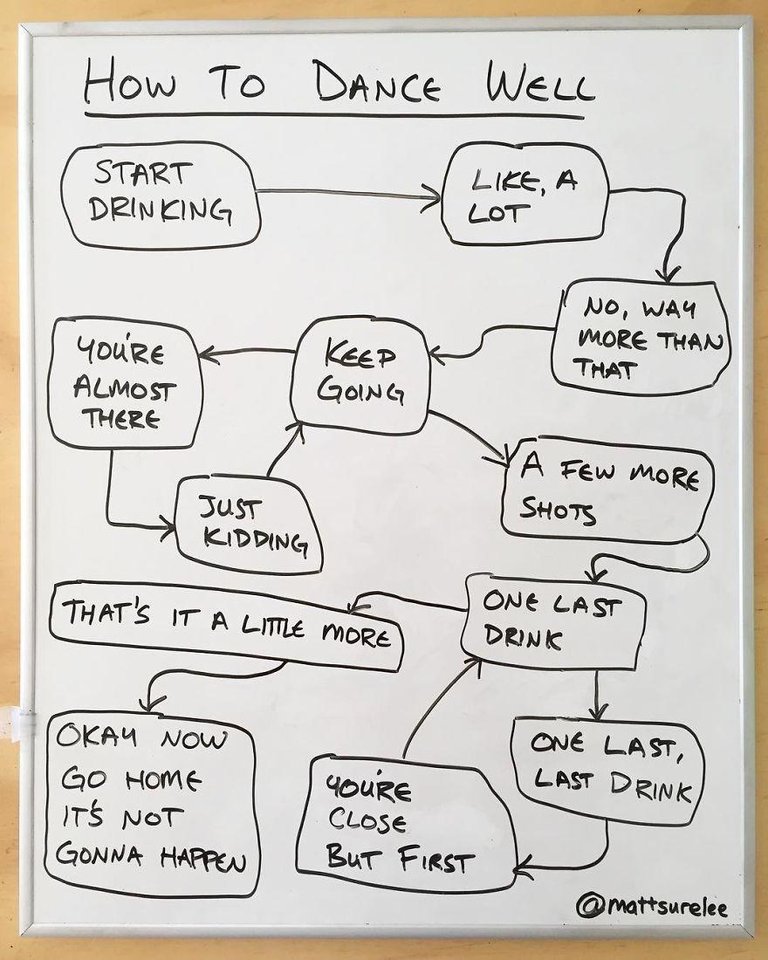
#35. How to dance well :
Hope you like the compilation. Please upvote if you do like it . Comment with your views in the comment section . Thank you .
Steem on !!!
Reference and image source -
https://www.boredpanda.com/funny-charts-matt-shirley
This crossed my mind after reading the post and getting some inspirations from @manchow:
Hey that's clever and I really like the way you depicted Maslow's hierarchy of needs in relation to steemian needs. And I must say it fits right in . You should go ahead with a post like this . That's really creative and thats what governs steemit . I'm glad you found some inspiration . And job well done .. following you for more .steem on !
I'll add this one to the rest of the series :)
these are great find! I can totally relate, the cop car behind you is 100% accurate.
That's so sweet of you to comment . And yes when I first looked at it and the way this guy explained everything in such simple way ,it like having a manual for day to day life situations . And you can actually derive some sense from it , the sense of outcome. And it somehow tends to be funny when we tend to know the outcome of an action. That's exactly whats this guy is aiming for . For us to relate with them charts . I really appreciate the time you spent going through this post and thank you so much resteeming it .. thanks a lot . See you around .. steem on !!
Hey @manchow you started something ! https://steemit.com/infographics/@plushzilla/steem-explained-in-diagrams-4#@plushzilla/re-ankapolo-re-plushzilla-steem-explained-in-diagrams-4-20171027t140653239z
Now this makes me happy. Somewhere I feel this is the real value of this community and people sometime tend to ignore this about steemit as they follow the crowd into a race for upvotes and followers . And I must thank you for finding my post worth resteeming as it's just been 2 weeks for me over here and my posts sometime don't get enough exposure. I'm glad @plushzilla found some inspiration and you helped spreading the idea .thanks again .
Steem on!
I love charts and infographics! It would be great to create some for the Steemit community as well if this is something of interest.
That's exactly what I was thinking when I uploaded this . To make something similar based on our work and life on steemit . Something with a clever and a funny touch to it. Will try coming up with something. Thanks for the comment . Steem on !