Thanks everyone for helping answer questions like this. I am having a hard time keeping up.. I think the answers below are great.. I can get maybe 30-50 position trades per month.. But i usually take 20ish.. and daytrades happen several times a day... So you can absolutely build a small account on position trades alone, without the need to take the added risk of daytrading or small account building type trades.. You can just swing those slower base type trades and still do good.. But with the Account building trades and other types of daytrades you can double your small account in a week or less sometimes.. so those are the options..
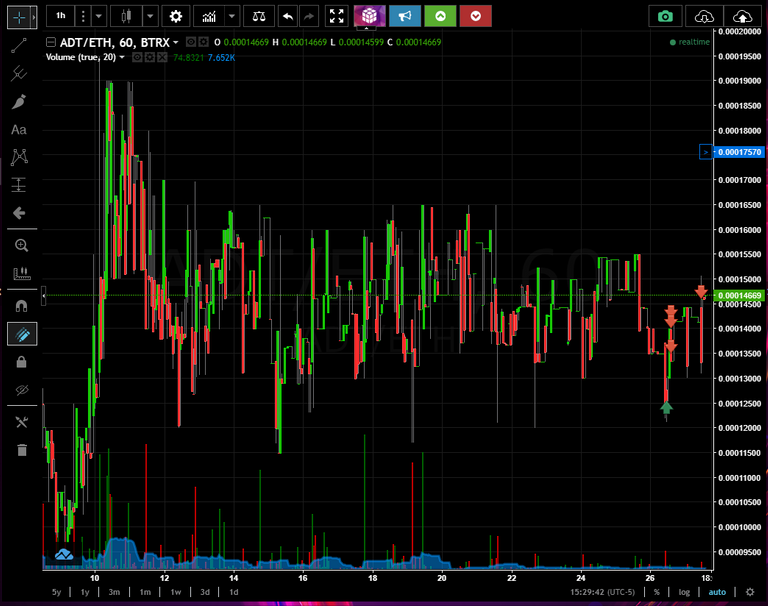
Let me take 2 seconds to show you a chart, that I just traded and please respond what think about it...
Notice that for the past two weeks you can buy 11s or 12s and sell 14s 15s and 16s even sometimes.. imagine the effect that has on a small account if you were only trading this one coin only.. and there are even better ones out there, im just using this one because i just just sold some right now..
These rises and falls comes in spurts throughout the day, likely from either a pump and dump action or some whale buying or selling huge. That's why you'll see no activity in the transaction history for a couple of hours sometimes. Lurk the chat on HITB and you may be able to catch a pump and dump
@quickfingersluc I've been trying to do the account builder trades. I've noticed a lot of the time I get "stuck" waiting for movement between " bid walls". There seems to be a lot of attempts at pump and dumps/manipulation down in the low volume alts.
the volume of trades on this chart scares me, there was no activity for 40 minutes this morning - should we not be concerned with that? On the bright side the lvl1 data shows some significantly sized orders ready to take place, but what if that was not that case - for example LGD/ETH [BTRX]?
The chart seems nice, and more lively than few others I've tried. It seems its common for ETH pairs to move in nice channels, and maybe even less common pairs like altcoin/XMR, but in BTC I didn't find any pairs with similar movement that would give me at least 10% reliably. To me it seems that in altcoin/BTC pairs it's better to trade pumps, coins with volatility like XST and UNB that have huge movement.
EXACTLY. The limitation trading these coins is how much one can put in an order. Typically you may only get a couple of ETH orders filled maybe 1k USD worth at the most, hence Luc's phrase of small account building trades
I did a few trades on something like SNM/ETH, I think this type of chart in essence is simpler(except liquidity problems when your orders don't get filled) to trade along with the base strategy. But I don't trust myself too much to trade btc pair pumps and daytrades, those seem much more complicated. Without using any TA I can read percentage of a pump, base, timescale, and how most of these coins seem to pump after a significant dip, but I don't feel that's reliable enough. And daytrading is a whole new level, along with considering the order book & news & etc(except getting in time for flash wicks down, these seem pretty safe to not lose out on). Maybe I should just get some ETH and move on to these range/channel types of charts for now.
Man, you seem smart enough to be making a killing off of these coins. Honestly, there is no TA other than your own analysis so trust your own judgement. Look at patterns, understand what is going on with the trading environment, and come up with a good strategy then go for it. This sounds pretty basic and sometimes it works out, sometimes it'll go against you.....just have a backup plan. More than often I think you'll win since its fuckin crypto, as long as you understand and read the chart correctly.
Also make sure to know which coin you are trading. Coins like UET you just dont want to touch.
Hey man, thanks for all your help and the great videos!!.. i've been drawing my bases , and ive noticed something.. i can see the bases a lot clearer with heikin ashi sticks instead of the candles.. i assume there is nothing wrong with that right?..
thanks again!
What are the best charts to watch for position trades? I only really know of the ETH/USDT chart.
All of them. I review all of the charts daily,this gives you the greatest opportunity for success.
...and you go back 1-2 months into the history to confirm that there the chart follows the pattern of base creation, base crack, panic, base creation, base crack, panic, base creation?
I have looked through many charts that seem to follow no particular pattern, and many more that don't follow the pattern that Luc is advocating that we look for... at least they don't follow it with any degree of consistency that we can count on.
I guess I was asking if anyone has identified charts that are in the ball park of reliability as ETH/USDT?
Once again, ALL charts have this reliability eventually - just be paitent and read the charts daily, eventually you will find the opportunities. Some charts I see prime opportunities in the past, but none currently - thats a fact of life while trading, its not free money, you still need to put in a little bit of work and be willing to take a risk.
With that said, here is an example of a chart which opened up to a great trading opportunity overnight. Once the price dips into the circle, your trade should be +EV if you sell upon the bounce back to the base.
https://www.coinigy.com/s/i/597e0e27c99d3/
Thank you for the reply and the chart share. I agree that I'll have to learn the story of the chart before being able to capitalize on oppurtunity, so I will keep trying to interpret them because apparently my thinking and pattern recognition is currently too rigid.
With the chart you shared, there is no way I would have recognized that base. There are a few instances of similar bounces working out, but it doesn't seem to follow much of a pattern to me. Especially since 12 hours later another bounce happened that was equal to the bounce you underlined, but we ignore that one. I also don't really understand your circle in reference to the underlined base, but I'll keep watching to see how it plays out.
I don't expect you to go back and forth holding my hand on this one, but I figured a response may help increase value for someone else that is struggling to understand this chart.
Thanks again, and all the best!
https://www.coinigy.com/s/i/597e19804d2b9/
https://www.coinigy.com/s/i/597e1a4620dfa/
@quickfingersluc -This chart looks great. Thank you so much for sharing this with us. I will definitely keep an eye on it. Can you also recommend some other coins that I should keep in mind (since you said there are others even better than this) ? whatever you feel might be an "account building" type of chart... this would help me a lot. I do understand that it
s my responsability to do my due diligence before buying a coin but I would love to have a few of those charts set up so if Im not asking too much please feel free to share others like this.Once again thanks for your input
Hi octavyo... did you have any luck finding those small building account charts?